How to Automatically Categorize Unstructured Text Data
Categorizing text data can be a time-consuming and expensive activity. In cases where time is short and budgets low, using automatic categorization of text data can save the day and give you a good idea of what’s contained in your data.
In the following example, I have some text data collected in a survey about Tom Cruise. The question was “What don’t you like about Tom Cruise?” and the responses are pretty varied. Categorizing these responses would normally take a good couple of hours, if not longer. Here, instead, I’ll run an automatic text categorization to see what main themes are of concern to the survey respondents.
How to run Automatic Text Categorization in Q
I’ve imported my data as usual and I’m ready to begin my analysis.
- Go to Create > Text Analysis > Automatic Categorization > Unstructured Text.
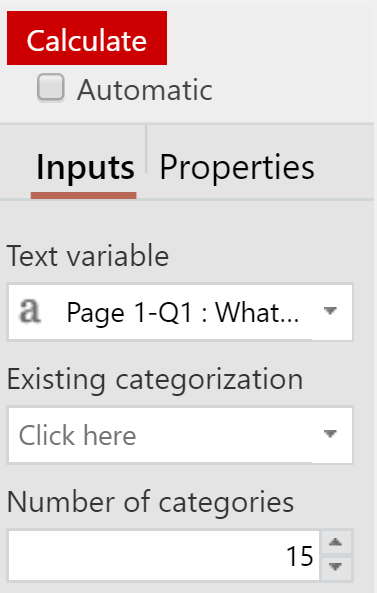
- In the object inspector (the section that opens on the right of the screen), under Inputs > Text variable select the variable that holds the text you want to analyze.
- Change the Inputs > Number of categories to the number of categories you would like to classify the data into. I’ve chosen 15 for this example.
- The output will calculate automatically, and looks like this:
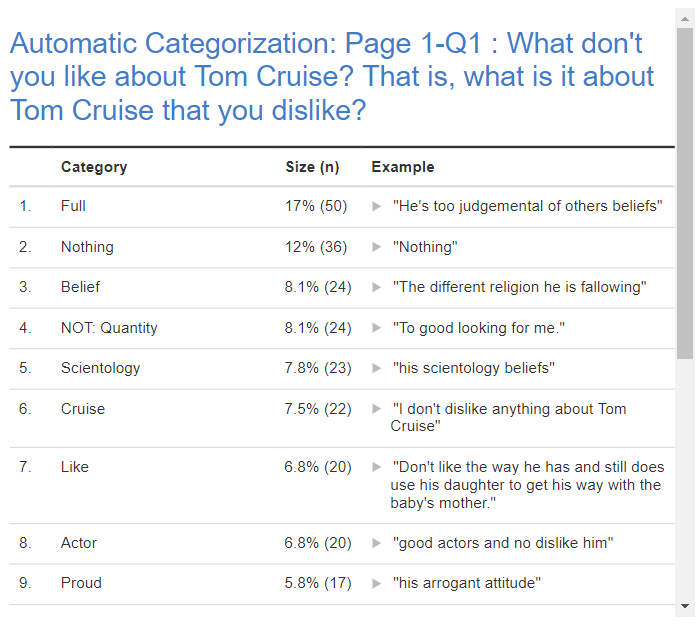
On the left of this output, you can see the automatically generated categories. The center column shows the proportions and counts of the number of cases in the file that has been allocated to that category. On the right, you can see examples of the types of responses that have been allocated. Clicking the ▶ button will show you all the text that’s been assigned to that category.
How to Save the Categories to your Data Set
Saving the categories assigned to your data – so that you can use them in other analyses – is easily done. Make sure that the output above is selected and then go to Create > Text Analysis > Advanced > Save Variable(s) > Categories. A new variable will appear in your Variables and Questions tab called “categories_page_…”. This new variable will store which category each case in your file has been categorized into. It allows you to then combine this categorized data with other variables in your data set.
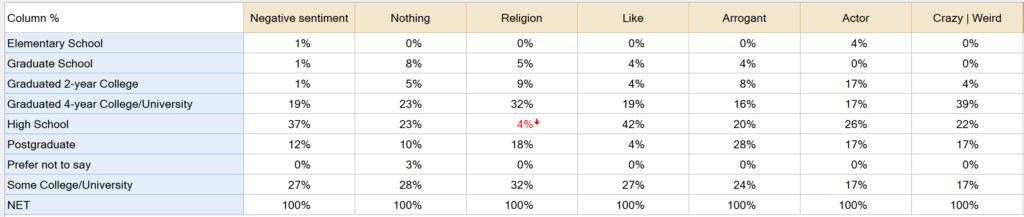
To create a simple example of a table that uses categorized data and another variable, use the report page that was created when you saved the categories as a variable. Use the blue and brown dropdowns to create a crosstab. In the table below, I reduced the categories to seven and crossed the automatically generated categories with the education level of the respondents in my data set.