

Comparing your Results to the Previous Period in Q

Q has a terrific feature whereby it can automatically compare statistics against the previous period (of time). This is great for tracking scenarios, when you are only interested in whether a figure has gone up/down since the last reporting period. Q gives you this ability if you are working with a Date question in a crosstab. We illustrate this in the first part of this post.
While it is a fantastic feature, it only works if you have a Date question as the columns of the crosstab. You must have a variable in your project that uses date-time data format.
It is frequently the case that researchers receive a categorical variable to encode the period of interviewing (rather than a date-time variable). It could be quarters, weeks, or some other ordinal information (e.g. wave). If this is your situation, don’t fear, because you can turn your categorical question into a Date question in Q.
The purpose of this post is how you can set up your data to compare to a previous period. If you already have a Date question, then you only need to follow through section 1 below.
- The first part shows you how you can set the statistical assumptions to compare to previous period with a date/time question. This is documented on our Q wiki here.
- The second part shows you how you can use a bit of simple code (JavaScript) to turn a categorical variable into a date /time variable. This is also documented on our Q wiki here.
What is “comparing to the previous period”, statistically speaking?
In a crosstab in Q, each cell in a row is compared to its complement by default. In the table below, Q considers the 2.4 average figure significant. This is because it compares it to the sample that is NOT Jul-Sep (i.e. is Jan-Jun). Testing against the complement is useful in a normal table, because you’re often looking for interesting differences among any of the columns. In this case, however, we might specifically want to compare each period to the preceding one.
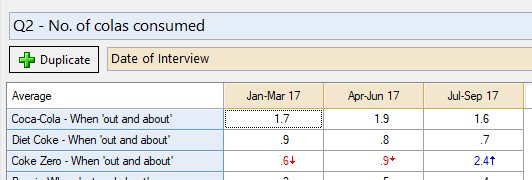
Tip: in Q, highlight the individual cell and push α (in the ribbon, or via right-click). The information includes the null hypothesis which tells you (in English) what you are comparing.
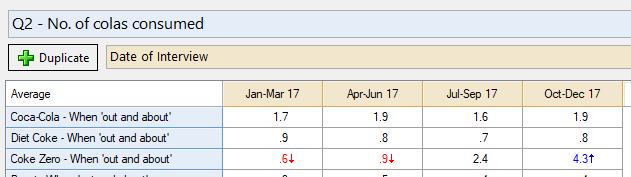
Consider what happens when you update your project to include a new quarter’s worth of data. In this example, the table updates automatically to include an Oct-Dec column. Now the significance indicators change, as per the below table. In this case, Q no longer highlights 2.4 as interesting in the context of the four quarters. Why? It is too close to the average of the other three periods combined – that is, (0.6 + 0.9 + 4.3) / 3 = 1.9
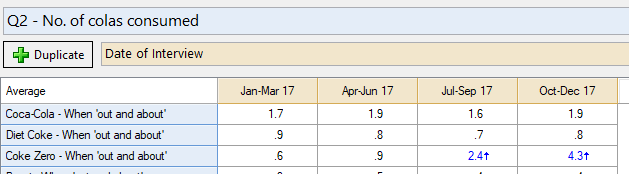
Now if we set Q to use Edit > Customize > Project Options > Statistical Assumptions > Compare to the previous period, then the indicators display something different. Consider the table below. Q suddenly considers the 2.4 significant. This is because it is comparing Jul-Sep to the period immediately prior (Apr-Jun). Q still highlights the 4.3, but for a different reason than before (4.3 now tests significantly higher than 2.4). By contrast, The 0.9 average (for Apr-Jun) is no longer significant, because it is higher than 0.6 on a pairwise test. Again, you can use α to see the test for yourself, this time selecting the relevant pair of cells.
How do you enable comparing to the previous period?
You can enable this feature by going to either the Table or Project options via Edit > Table Options or Edit > Project Options > Customize. Within the Table/Project Options is a Statistical Assumptions tab, and on the bottom left is a drop-down menu for Date questions, where you can set it to compare to previous period. We have this documented on the wiki here.
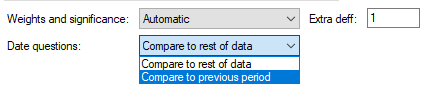
Whether this setting is on or off, it will be clarified in the footer of the table by default when you use a Date Question. It will either say “Significance Testing: Compare to previous period” or “Significance Testing: Compare to rest of data”.
![]()
How do you turn a categorical variable into a Date question?
Suppose you have a categorical variable called “wave”. It encodes the wave as (1 = wave1, 2 = wave2, 3 = wave3, and 4 = wave4). You want to turn “wave” into a proper date-time variable, to use it as a Date question. This is where a JavaScript variable sorts you out.
You can make a JavaScript variable by Create > Variables and Questions > Variables > JavaScript Formula > Numeric (this is also available via a right-click in the Variables and Questions tab). In the JavaScript Variable expression window, you’ll use a simple IF AND ELSE IF expression combined with Q’s Q.EncodeDate() function, like the following:
if (wave == 1) Q.EncodeDate(2018,01,31);
else if (wave == 2) Q.EncodeDate(2018,02,28);
else if (wave == 3) Q.EncodeDate(2018,03,31);
else if (wave == 4) Q.EncodeDate(2018,04,30);
In this case, we’re reassigning each of the wave variables to the last day of the month in 2018 from Jan to April respectively. You could set it to any date, as long as it’s in the format (yyyy,mm,dd). As with all JavaScript variables, be sure it checks out in the Preview Panel at the bottom of the window. Push OK to save the variable. Our video on JavaScript variables demonstrates this process.
You now have a new numeric variable in your Variables and Questions tab. Change the variable type to “Date/Time” and you’ll now have a new Date/Time question. Be sure to check the Values to set your desired aggregation.
This Date/Time question will now be available for you to use in your cross-tabs. And, pertinently, for use with the statistical testing against previous period!


