

How to Create a Top 2 Box Score in Q

Every market researcher needs to know how to create a Top 2 Box Score. In today’s post, I’ll you how you can easily do it in Q.
What is a Top 2 Box Score?
A Top 2 Box score is a common means for reporting results of categorical scale questions. It combines the top two responses to give a clearer picture of the positive results.
Let’s look at the following 5-point satisfaction scale:
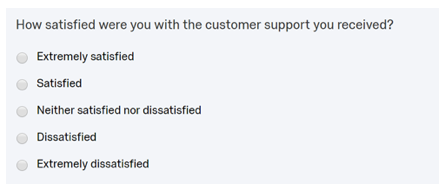
In this case, the first option in the scale (Extremely satisfied) is known as the top box. The percentage of respondents who selected this option is simply called the Top Box score.
Likewise, the Top 2 Box score is defined as the percentage of respondents who selected either the top box (Extremely satisfied) or the second box (Satisfied) response. Thus, the Top 2 Box score is the percentage of respondents in the sample who have expressed some level satisfaction.
In this post we look at the different ways for creating top boxes in Q. The method you’ll want to use depends on how you’ll want to present your results.
Creating a top 2 box on a table
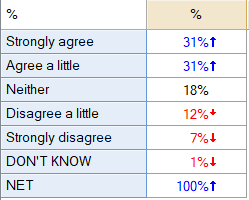
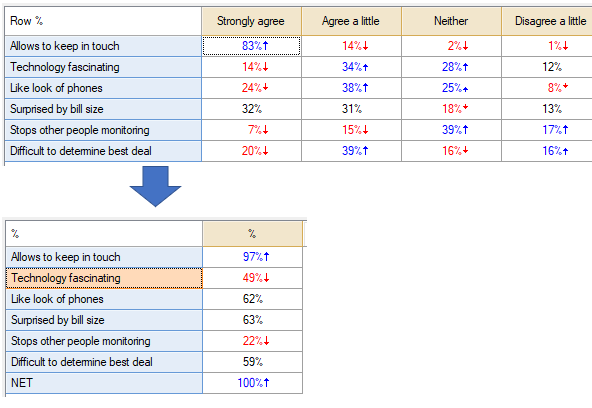
The most direct way for creating a Top 2 Box score in Q is through merging categories or creating NETs on a table. Using the following table as an example, drag and drop the second box response (Agree a little) onto the top box response (Strongly agree):
Once one category is placed over another, the word “Merge” appears.
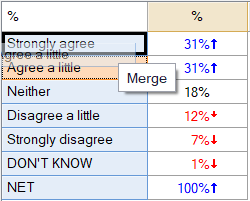
Q will automatically name you merged categories as “Strongly agree + Agree a little”
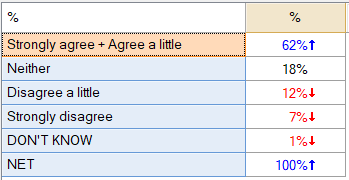
You can also rename the category to whatever your heart desires. To do so, right click on the category name, select Rename, type in the desired text, and click OK.
If you want to show the individual categories as well as the Top 2 Box score on one table, you will need to create a NET. This can be accomplished by selecting the 2 categories (by holding down the CTRL or SHIFT key), right clicking, and then selecting Create NET.
Creating a top 2 box by restructuring the data
The other means for creating a Top 2 Box score is to restructure the data as a Pick Any (multiple response) question. The Pick Any question type allows you to tell Q to only count particular responses – in this case to only count people in the top 2 categories. This approach makes it easier to create crosstabs which include top boxes for several items.
To do so:
- Right-click on a table showing your question.
- Find the name of the question in the context menu.
- Select Restructure Data > Multiple Categories (Pick Any).
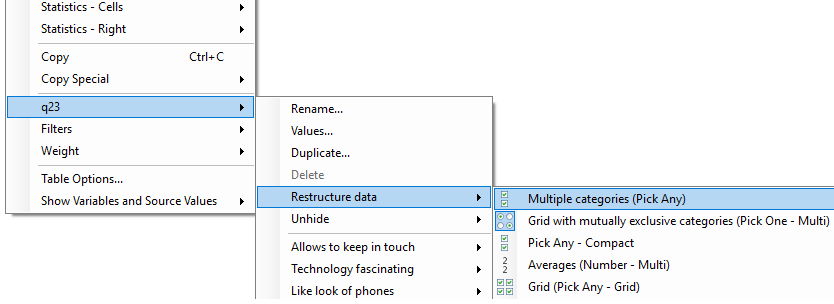
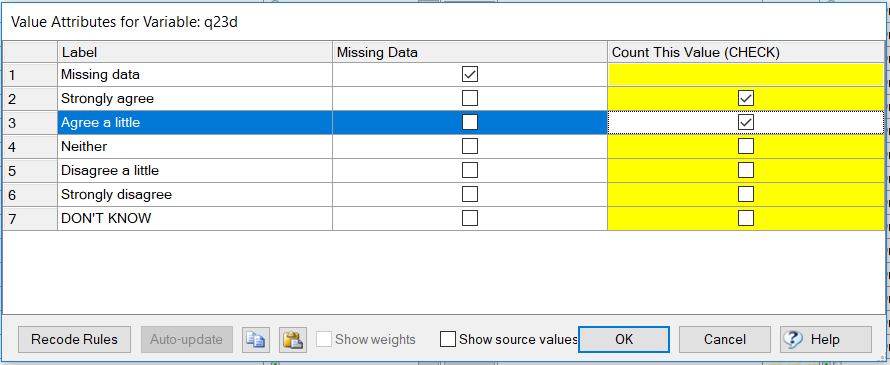
- When prompted, make sure the top 2 categories are selected in the Count This Value column and click OK.
The question will now only display the Top 2 Box score when loaded to the Outputs tab.
Automated solutions
Q’s Online Library features some tools for creating top boxes in an automated way. This is helpful when you have a lot of different questions to work through. You can find options for creating top and bottom boxes in the Create New Variables section and the Modifying Data section of the Online Library.
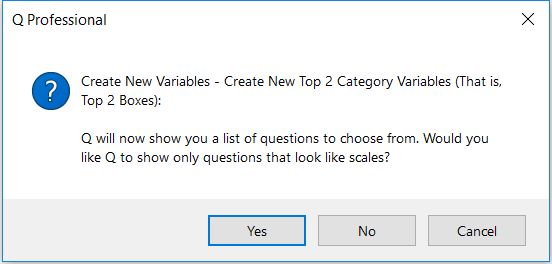
The option Create New Top 2 Category Variables (That is, Top 2 Boxes), creates new variables that show Top 2 Box scores for Pick One and Pick One – Multi questions. Summary tables for these new questions will be listed under a new folder within the report tree. Categories which look like Don’t Know options will not be included in the top boxes. When Q identifies one of these categories, the script gives you the option to remove them. To use this option:
- Select Automate > Browse Online Library > Create New Variables > Create New Top 2 Category Variables (That is, Top 2 Boxes).
- At the first prompt, choose between Q limiting your choices to questions it has identified as scales or presenting you with the full question list.
- Choose questions to create top boxes for. Hold down the SHIFT or CTRL keys to make multiple selections. Click OK.
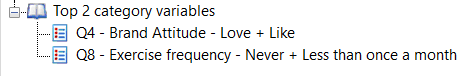
- Q will now generate a new folder within your report tree called Top 2 category variables and generate summary tables for each of the newly created questions.
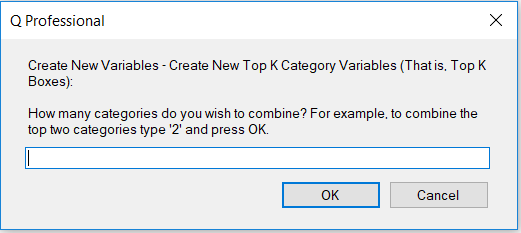
To add top box NETs, you can instead use the option Create New Top K Category NETs. You will be presented with the same choices, with one additional choice to specify the number of top categories you wish to combine. That is, you can use this same tool to make top 3 boxes, and so on.
We hope you found this guide helpful! For more tips check out the Market Research or the Using Q sections of our blog.
If you’ve got questions, feel free to book a personalized Q demo now!


