

Advanced Analysis Techniques | Correspondence Analysis | Dimension Reduction | Visualizations
Easily Add Logos to a Correspondence Analysis Map in Q
by Tim Bock


You can take your correspondence analysis plots to the next level by including images. Better still, you don’t need to paste in the images after the analysis is complete – you can include them right from the start.
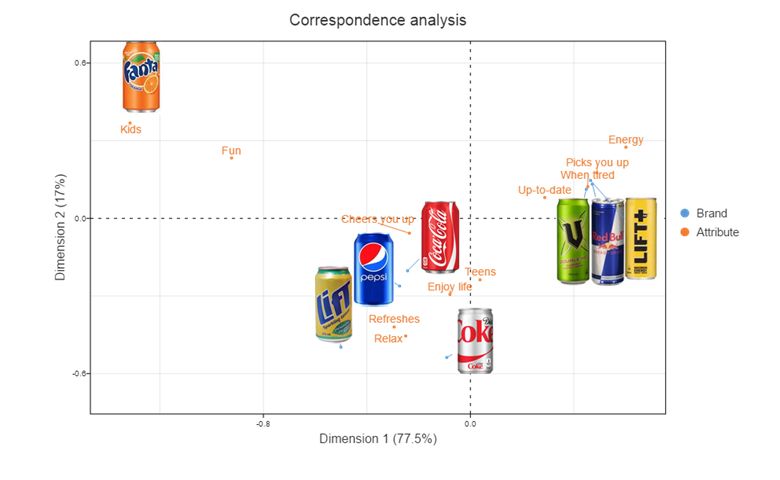
The visualization above shows the results of a correspondence analysis. I ran it on data showing how people perceive different carbonated soft drinks. Logos, which are from jpeg files, are shown instead of brand names, with lines and dots indicating the precise location of the brands.
Creating such visualizations in Q is straightforward:
- Create logos of similar sizes, and put them somewhere on the web. The most straightforward way to do this is to use dropbox and share the files. Make sure that you check this has worked by pasting the URLs into your browser; if you do not see the logo, something has gone wrong.
- In Q, select Create > Dimension Reduction > Correspondence Analysis of a Table.
- Select the data you wish to analyze in the Table field. If you want to instead manually enter the data, change Data source to Type or paste data and press Add data.
- Check Automatic and inspect the correspondence analysis to see that it is appropriate.
- Check Use logos for rows. If you want to instead use logos for the data in the columns, check Switch rows and columns.
- Paste your URLs, with commas between them and quotation marks around them, into the Logos box and press Calculate. The order of the images in the list should match the order of the rows in the table. The list of URLs that I used in the example above looks like this:
"http://docs.displayr.com/images/9/90/Coke.png",
"http://docs.displayr.com/images/7/7c/V.jpg",
"http://docs.displayr.com/images/8/82/RedBull.jpg",
"http://docs.displayr.com/images/d/dc/LifePlus.jpg",
"http://docs.displayr.com/images/0/09/DietCoke.png",
"http://docs.displayr.com/images/d/da/Fanta.jpg",
"http://docs.displayr.com/images/e/e8/Lift.png",
"http://docs.displayr.com/images/5/5e/Pepsi.jpg"
The resulting visualization, shown below, is interactive. You can manually move the logos and the labels around.


