
Changing the Way Your Data Looks so You Can Do More with It
Q understands the language of survey data, and this allows it to automate important aspects of your workflow. It sets up your data in a way that mirrors how you ask the questions in your survey. In Q we have the concept of “Question Type”. This setting determines the layout of your tables, the right statistical tests to use, and more. Q is flexible and allows you to change how it is thinking about your data and to look at your survey questions in different ways. In this post, I talk about Question Types, the heartbeat of Q, what they mean and give a short tutorial on how to use them to control your analyses. If you want to learn how to take control of your data in Q, read on!
What is Question Type?
Question Type is an extra layer between your survey data and your analysis that allows Q to understand the meaning of the data. Q automates many aspects of your workflow using this understanding. When you import your data, Q groups the variables into Questions, and assigns each a Question Type to reflect how the question was asked in your survey.
If you are used to more menu-based tabulation and analysis software, this concept can seem a bit like magic! It means you don’t need to go hunting through menus and choosing which option is right for analyzing each bit of data. The Question Type setting determines the right statistics to show in your tables (e.g. counts, percentages, averages, etc.), the statistical tests that are used, and how your data will be understood when you apply more advanced analyses (like regression and segmentation).
Q works all this out when you import your data. The better quality your data file, the better Q will be able to work out what your data means. If you want to analyze your data differently, you can always control the question type as you work.
Most common question types
Here’s a run-down of the most common question types that you’ll use in Q. These will be the bread-and-butter of most projects. For a complete list, check out our Wiki. You can identify the question types by checking the icons that appear next to your questions in the Blue drop-down menu in the Outputs tab:
Single response:  Pick One
Let’s start with the easiest – single response. Q’s name for single-response data is Pick One. The survey respondent is presented with a set of options, and they can only pick one.
Multiple response: Pick Any
Next comes your traditional multiple-response style question, which Q calls Pick Any. Your respondents see a menu of options, and they can pick any of them. One, or some, or none. Q will group the options together and show you the percentage of respondents that selected each of options.
Single response grid: Pick One – Multi
Often your survey will ask a single-response question, like a satisfaction scale, in a loop over the different brands or attitudes that you are trying to measure.
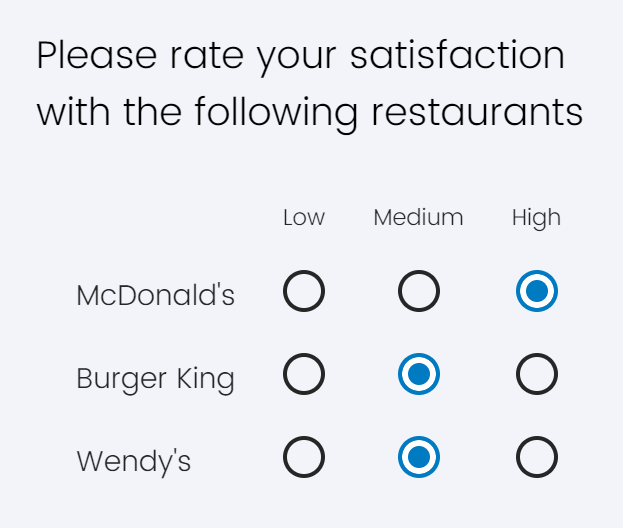
This is sometimes called a single-response grid, but there are a few other different terminologies around. Q calls this a Pick One – Multi question. There are multiple options (or multiple variables) grouped together, and each is single-response. The variables for the different options will be grouped together so that you can compare the distributions.
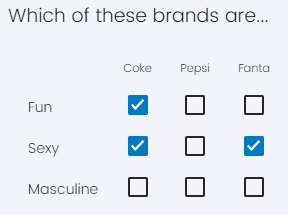
Multiple response grid: Pick Any – Grid
Grid-style questions may also give the respondent the opportunity to select multiple answers for each row and column. This is sometimes referred to as a multiple-response grid question, and Q’s name for this is Pick Any – Grid. A survey question of this kind might look a bit like:
When Q sees data in this structure, it will group the variables together, work out what the rows and columns should be, and show you the percentage of respondents who ticked each option.
Numeric data: Number and Number – Multi
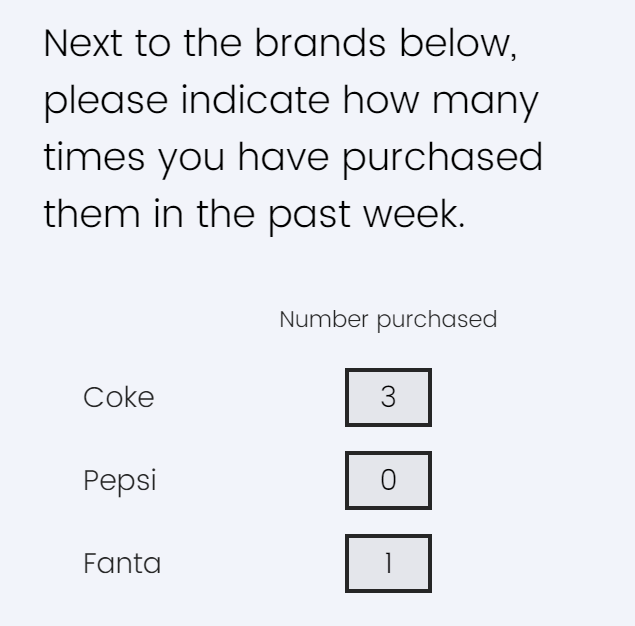
For numeric-entry questions, like the one shown below, your tables will show Averages and other numeric statistics instead of counts and percentages for the previous examples. Q’s terminology for numeric questions is Number, for a single numeric response, or Number – Multi for a group of related numerical responses.
Tutorial – Changing Question Types
The following tutorial shows you how changing the question type allows you to control how Q is treating your data. A simple change of question type (from Pick One – Multi to Pick Any) allows you to create top box scores from a five-point scale. Alternatively, using the Number – Multi question type allows you to calculate an average score for each scale.
Step 1: Open Q.
Step 2: Select File > Data Sets > Add to Project > From File….
Step 3: Find C:\Program Files\Q\Examples on your computer, select Cola Tracking – January to September.sav, and click Open.
Step 4: Click OK when prompted about setting up the data. At this point, Q scans through and sets up all the questions and choose a Question Type for each.
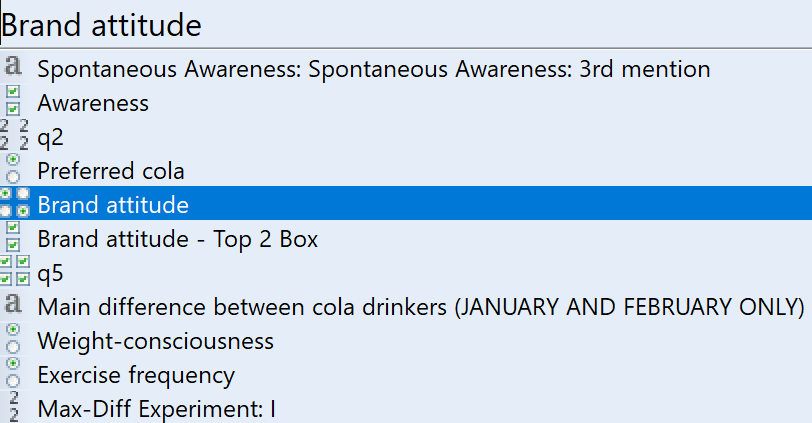
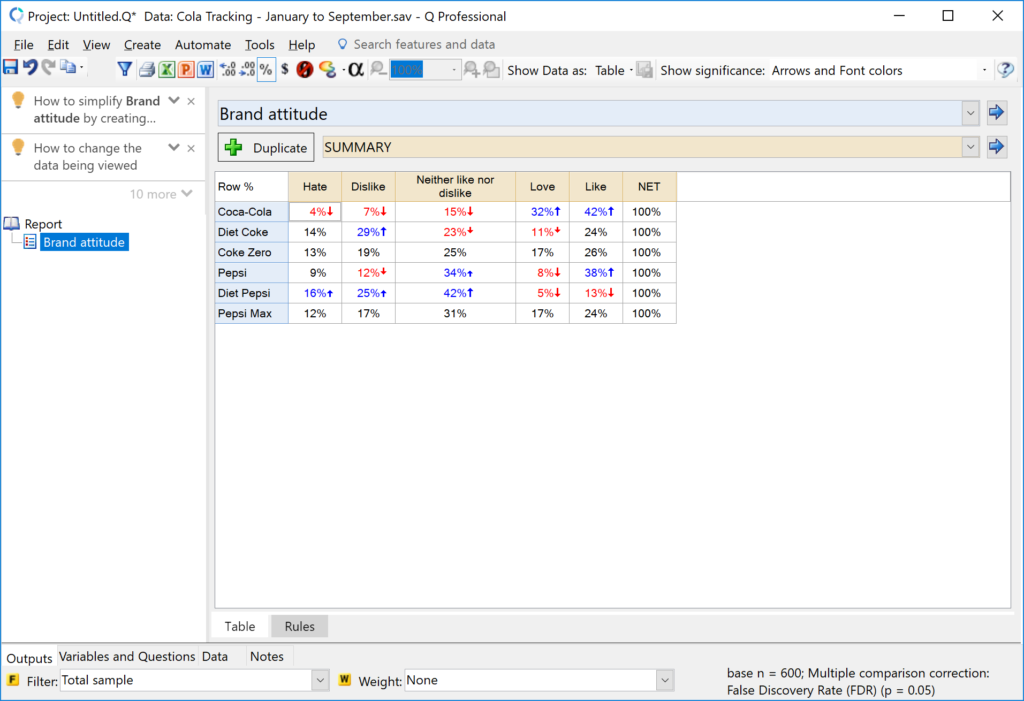
Step 5: Click into the Blue drop-down menu in the Outputs tab and choose the Brand attitude question.
Brand attitude is a five-point scale that was asked in a loop for each of six brands of cola. In Q, this is called a Pick One – Multi question. The table shows the percentage of people who selected each part of the scale, but you can use this same data to count top boxes, bottom boxes, or compute average scores, depending on your reporting needs. Next, we’ll make top boxes.
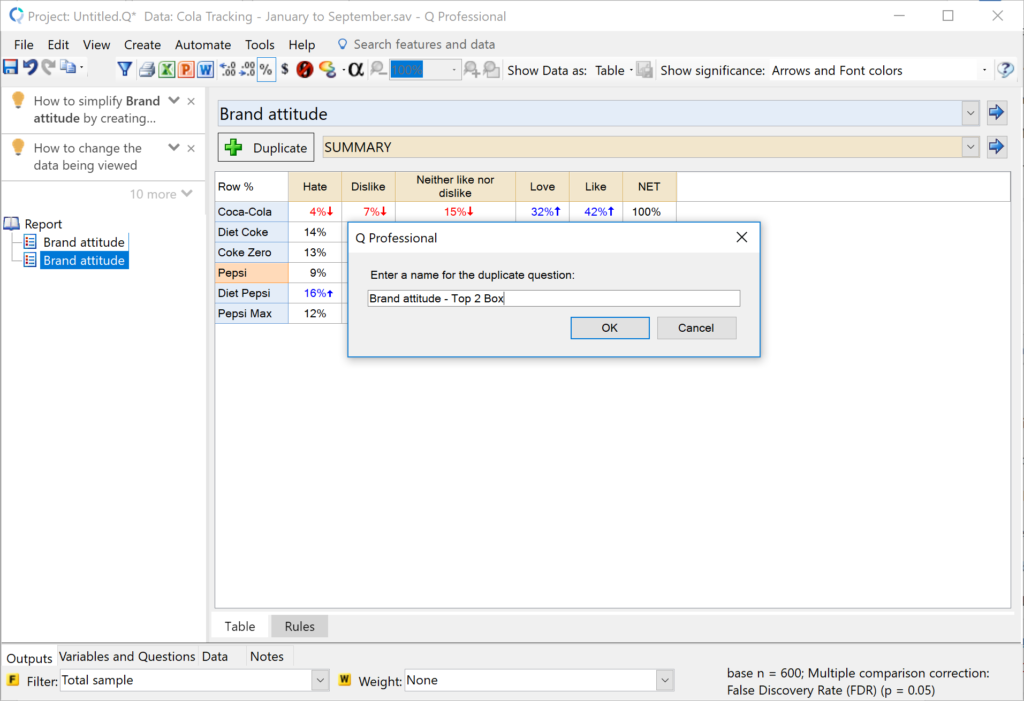
Step 6: Click the + Duplicate button. This makes a new table and saves the previous table above.
Step 7: Right-click one of the rows in the table and select Duplicate question. Enter the name Brand attitude – Top 2 Box, and click OK. This creates a whole new copy of the brand attitude question. You can change the new copy.
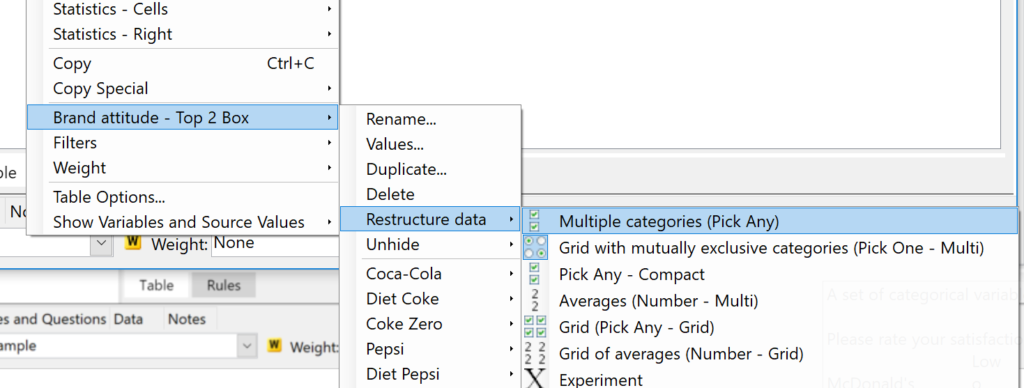
Step 8: Right-click on one of the rows of the table and select Brand attitude – Top 2 Box > Restructure Data > Multiple categories (Pick Any).
Step 9: When prompted, check the top 2 categories (Love and Like) are ticked in the Count this value column and click OK.
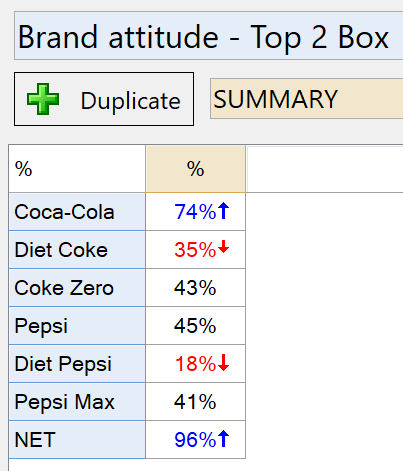
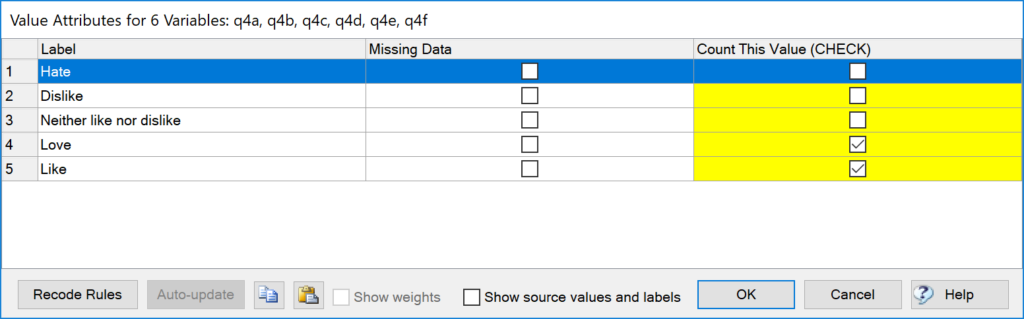 The result is a table which only counts people in the top 2 boxes – Like and Love. This makes for a table that is easier to read…
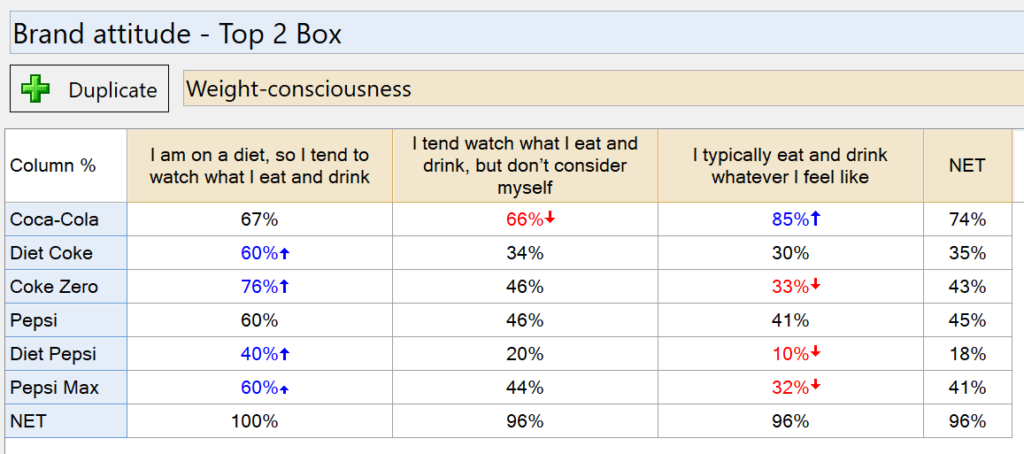
and a question that is easier to crosstab with others…
Question type is the key to communicating the meaning of your data to Q so that it can automate your analyses.
Getting help
Whether you are a paying customer, doing a trial, or just want to ask a question about Q, you can reach our great support team at [email protected]. We’d love to hear from you!
If you’d like a one-on-one demonstration with a member of my team, click here to book.


