How to Do Advanced Analysis in Q (No Need to Rely on Others)
Q can do so much more than generating tables. You can do segmentation, key driver analysis, MaxDiff, and a whole range of other advanced techniques. In this article, I give you an overview of what is possible in Q, and show via a worked example how to run correspondence analysis – a technique most market researchers have used at one time or another for marketing mapping.
Q’s Create menu is where you can find its complete kit of advanced analysis. I cover a few of the popular ones below and encourage you to explore the Create menu to see the full selection of what’s available.
Although they are dubbed “advanced” techniques, Q actually enables you to run and customize your analyses very easily. The worked example I present upfront (for Correspondence Analysis) exemplifies the basic workflow in running an advanced analysis in Q.
What can you do in Q?
The advanced techniques that people ask us about the most are MaxDiff, driver analysis, segmentation, and correspondence analysis. These are among the most powerful techniques in the market researcher’s toolkit. Of course, Q has much more available – regression, ANOVA, PCA, the list goes on. Here, I’ll briefly introduce the favorites, and below I will give you a tutorial on correspondence analysis to give you a feel for how to interact with some of the more advanced tools.
MaxDiff
Q’s MaxDiff tools are available by selecting options from Create > Marketing > MaxDiff. From here you can set up your experimental design, conduct the analysis, and save additional variables related to your analysis. The two main analysis tools are Hierarchical Bayes, which is the state of the art for estimating MaxDiff models, and Latent Class Analysis, which is a powerful alternative when your goal is to create market segments based on the MaxDiff data.
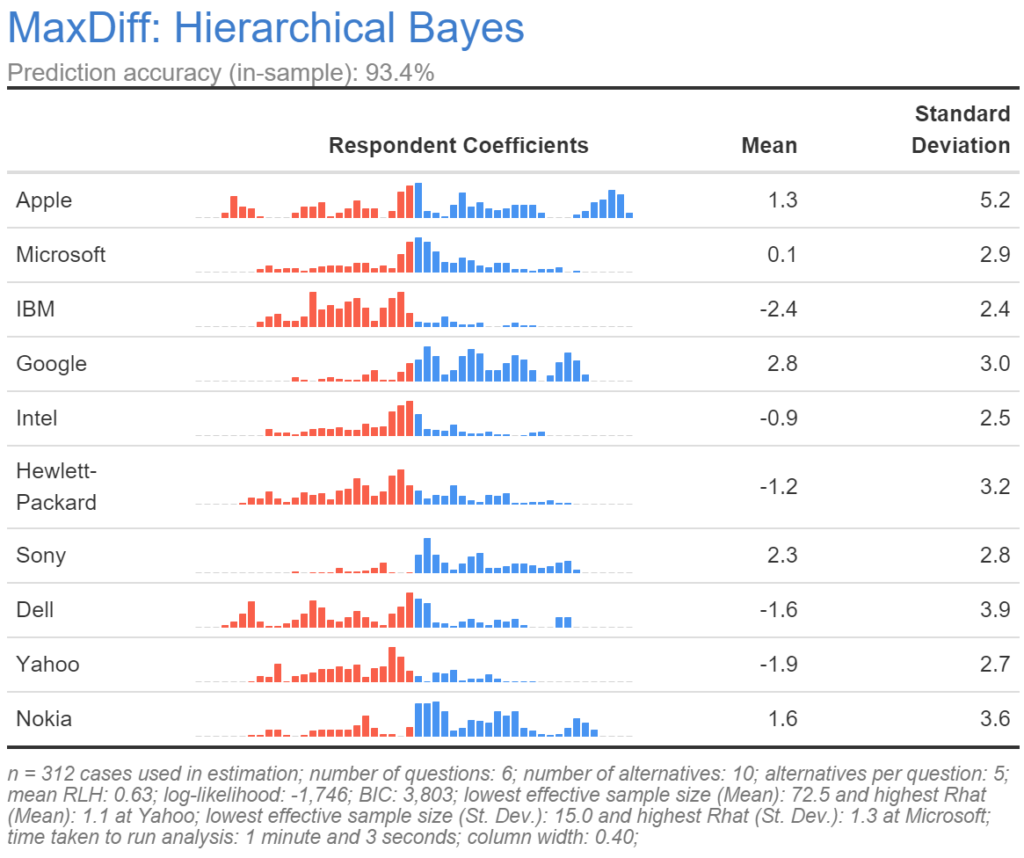
The output table will allow you to see the distribution of preferences for the items in your MaxDiff and to quickly find the stories. For more depth on MaxDiff analysis, check out our Webinar, eBook, and even the Displayr blog, all of which have tips, tricks, how-to’s, and information about best practices.
Segmentation
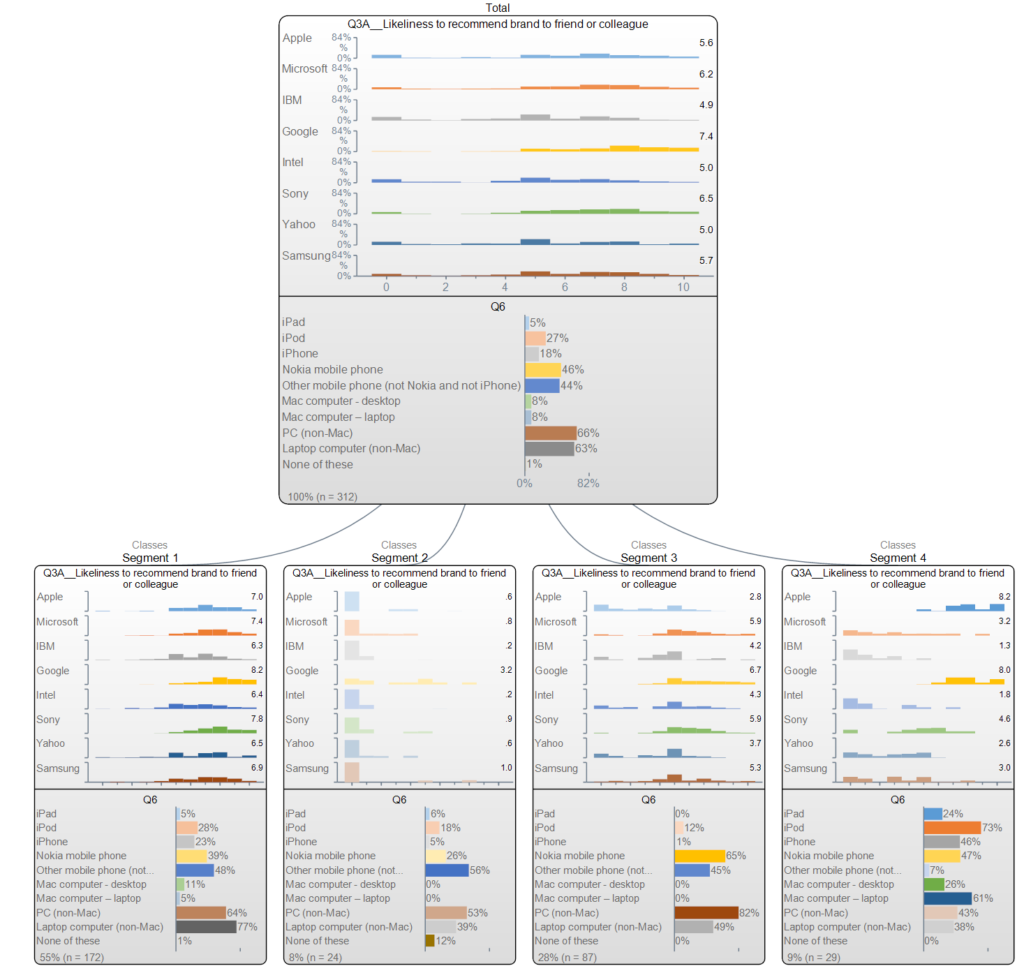
Q’s most powerful segmentation tool, which uses Latent Class Analysis, is accessed by selecting Create > Segments > Latent Class Analysis. Latent Class Analysis is a state-of-the-art technique for segmentation, because it can mix questions of different types and, unlike other tools, it can include cases which have some missing data.
The latent class analysis produces two key outputs. The first is a tree diagram, like the one below, which shows how the respondent data varies by segment. The second key output is a new variable which contains the segment for each person. You can use this in a crosstab to see how your the people in your segments vary in the rest of the survey, and you can feed it into other analyses.
We’ve got a couple of great resources for learning more about how to do segmentation in Q, and on the general do’s and don’ts of market segmentation. Just check out our Webinar or eBook on the topic to learn how to improve your segmentation game with Q.
Driver analysis and regression
Driver analysis (or key driver analysis) is available in Q by running one of the regression options, Create > Regression > Linear (or Ordered Logit, Binary Logit, Poisson, and more), and then using the Relative Importance Analysis option in the Output menu. Relative importance analysis, also known as relative weights, is a powerful algorithm for understanding the importance of drivers.
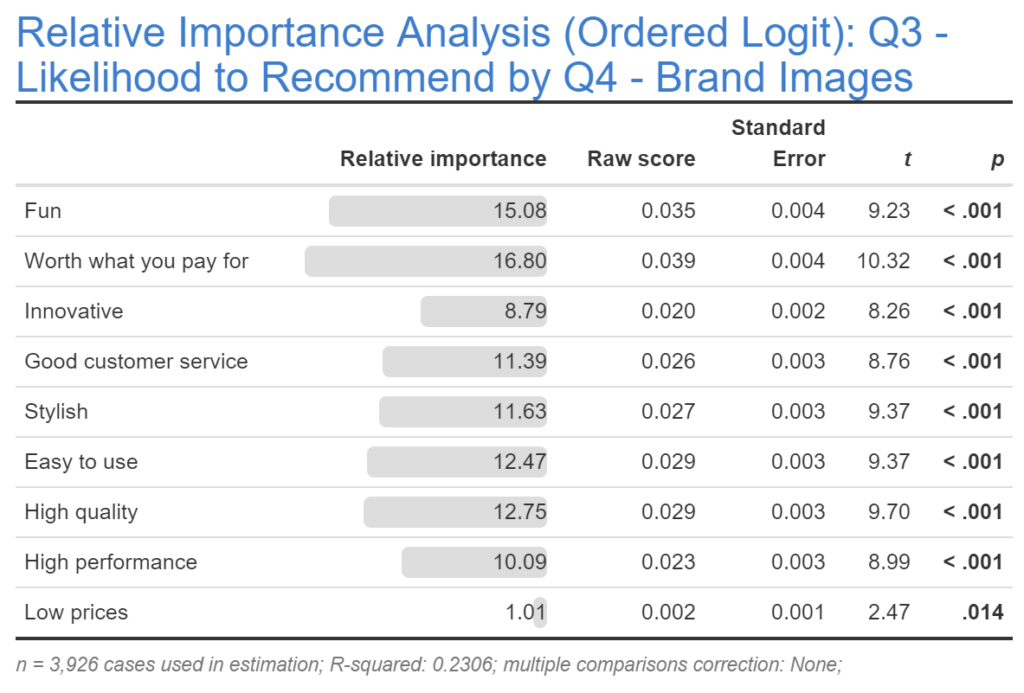
The output table makes it easy to quickly identify the most important drivers.
Options for Shapley, Krusal, and other driver analysis algorithms are available under Create > Regression > Driver (Importance) Analysis. For a deep-dive on driver analysis, check out our eBook and webinar on the topic, and our blog.
Try for yourself: Correspondence analysis
Correspondence Analysis is a popular technique in market research (particularly for market mapping). In this analysis, I’m going to share the key steps in running a Correspondence Analysis in Q, as an example of the typical advanced analysis workflow.
Step 1: Open Q.
Step 2: Select File > Data Sets > Add to Project > From File….
Step 3: Find C:\Program Files\Q\Examples on your computer, select Cola Tracking – January to September.sav, and click Open.
Step 4: Click OK when prompted about setting up the data. Q will set up the data automatically.
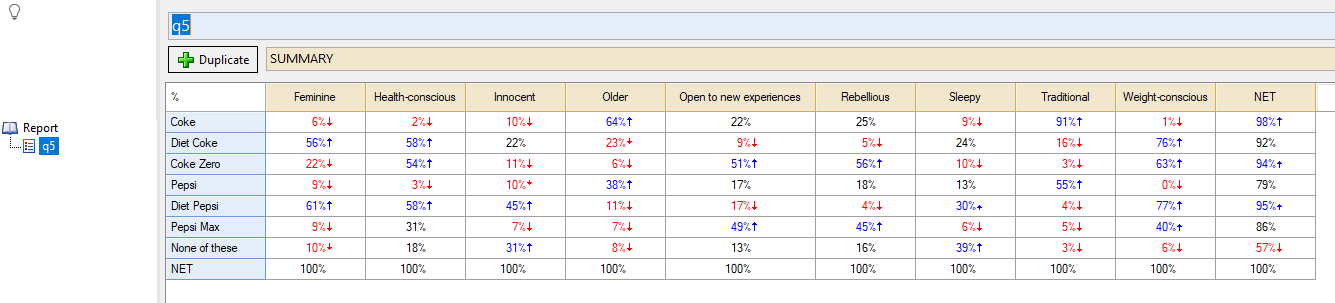
Step 5: In the Outputs tab select q5 in the Blue drop-down menu, and SUMMARY in the Brown drop-down menu. This is a Pick Any – Grid question, so it has columns as part of the question. It’s a question examining brand image (brands associated with personality attributes)
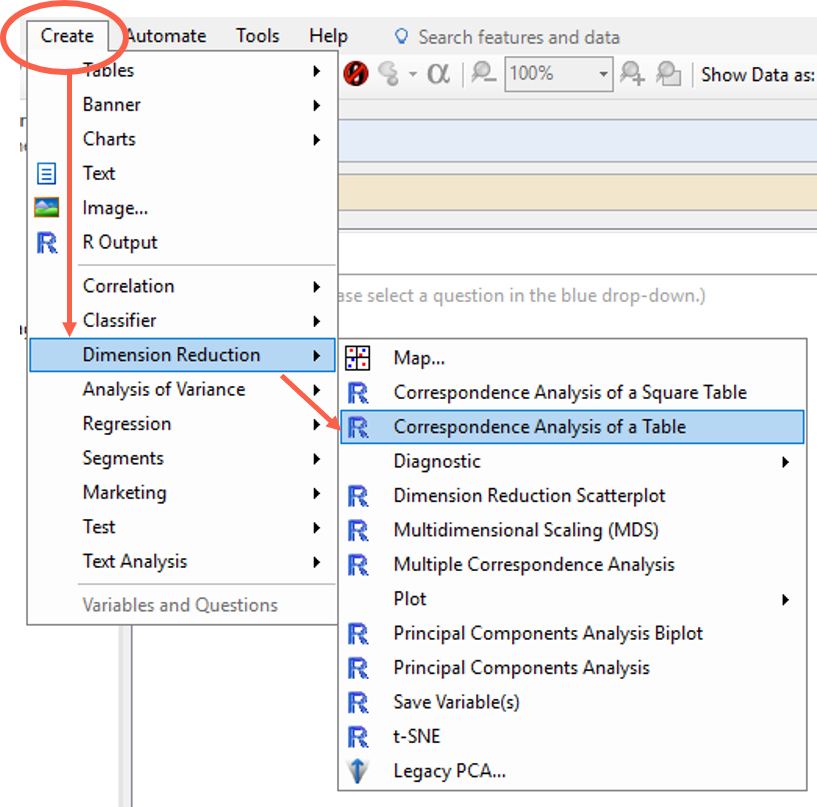
Step 6: Select the Correspondence Analysis feature from the Create menu. In this case, it lives under Create > Dimension Reduction > Correspondence Analysis of a Table.
Step 7: Specify the input. This is the over on the right-hand panel (called the Object Inspector). You then need to enter a source input table, which in this case is the q5 brand image table in the report.
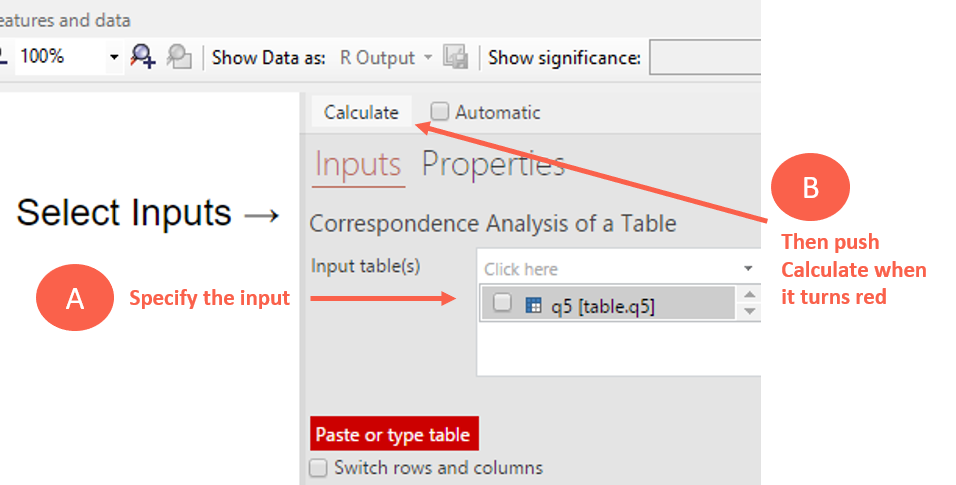
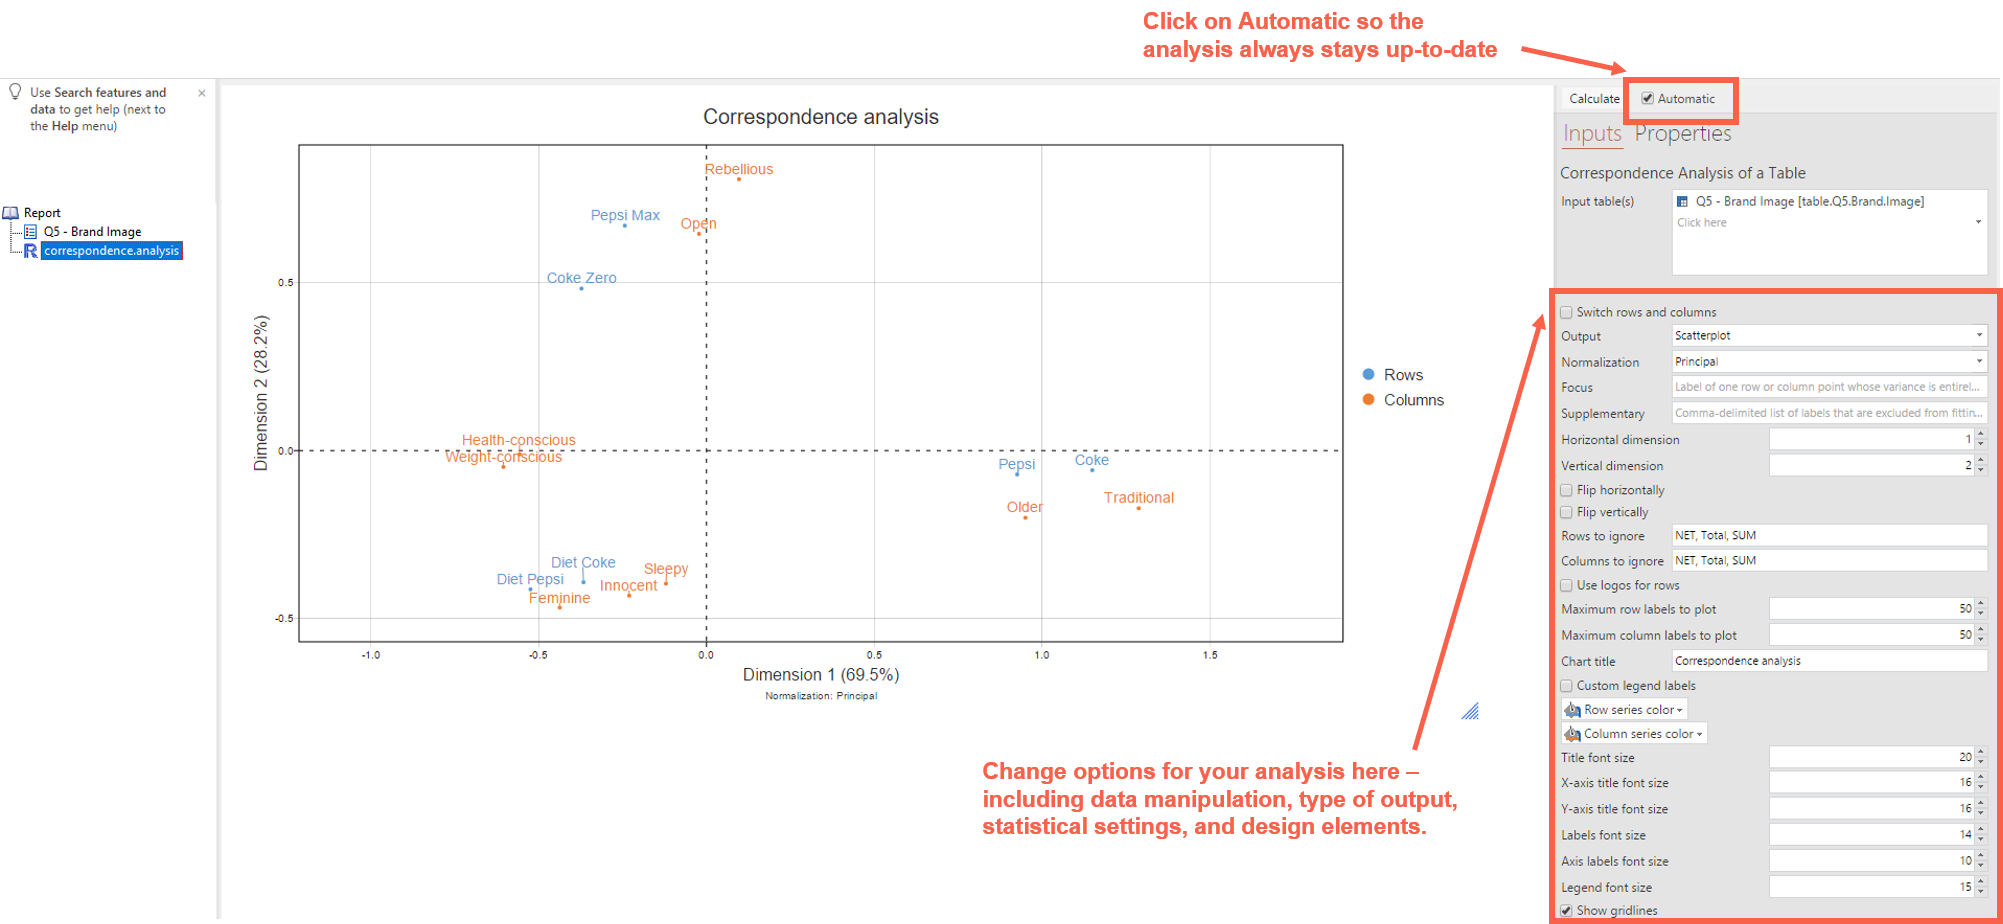
Step 8: Push Calculate (or tick Automatic) at the top of the Object Inspector to generate the model. The model then calculates, and you see the Correspondence Analysis output (as a scatterplot) in the main output area.
(Optional) Step 10: You can change the options for the analysis in the Object Inspector, such as how the data is interpreted, the type of output (e.g. change from Scatterplot to a Moon Plot to see what happens!), the statistical settings (e.g.: Normalization) and certain design options.
Our blog has a whole lot more about customizing your correspondence analysis, including adding logos. For a deeper discussion of how correspondence analysis works, when to use it (and when not to use it), check out our webinar and eBook.
Getting help
Whether you are a paying customer, doing a trial, or just want to ask a question about Q, you can reach our great support team at [email protected]. We’d love to hear from you!
If you’d like a one-on-one demonstration of Q with a member of my team, click here to book.