How to Apply an LDA Typing Tool in Q
After running a market segmentation, one problem many researchers commonly face is how to go about assigning respondents in subsequent surveys to the existing segments. One common approach is to identify the segmentation’s “golden questions” using a machine learning algorithm, such as Linear Discriminant Analysis (LDA). The LDA generates discriminant functions which can then be used to construct what is commonly referred to as a typing tool. This tool is used to allocate individual respondents into segments. This is typically done in Excel or some other spreadsheet software, but how can we reproduce this tool using Q? Better yet, how can we assign an entire sample from another survey to our final segments? This post explains how to create a classification algorithm typing tool in Q using the LDA discriminant functions.
Note that if you want to apply the results of segmentation to additional respondents from the same survey, then it’s probably better for you to follow the techniques outlined in this post. The purpose of the current article is to show you how to take discriminant functions produced in one data set and program them to predict segments in a different data set which contains the same variables, or re-use an LDA typing tool that has been given to you as an Excel spreadsheet.
Latent Class Segmentation
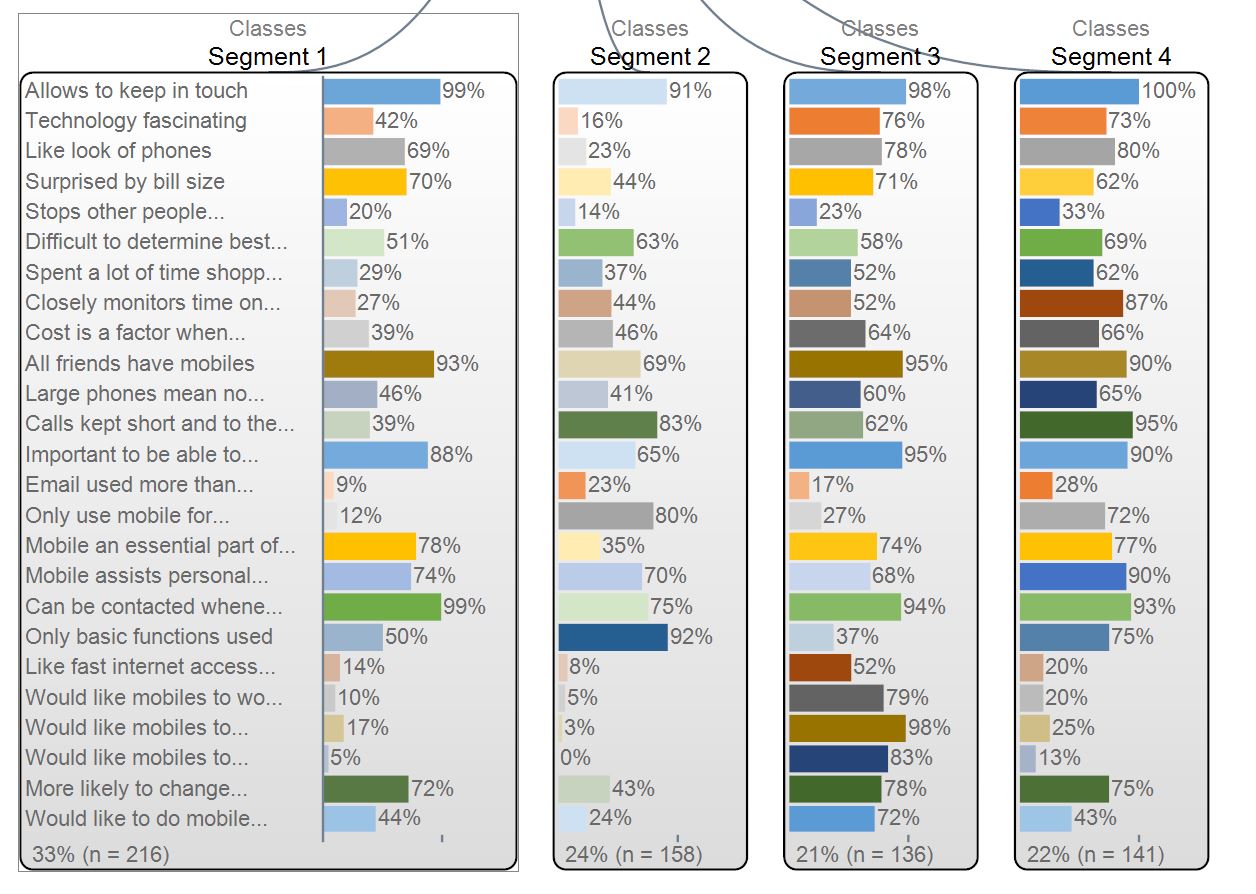
As an example, I’ve run a Latent Class segmentation from a sample of 725 cell phone users. I’ve used the top 2 box scores from a 25 question attitudinal battery as input to the Latent Class Analysis and settled on a 4-class segmentation solution.
Discriminant Functions
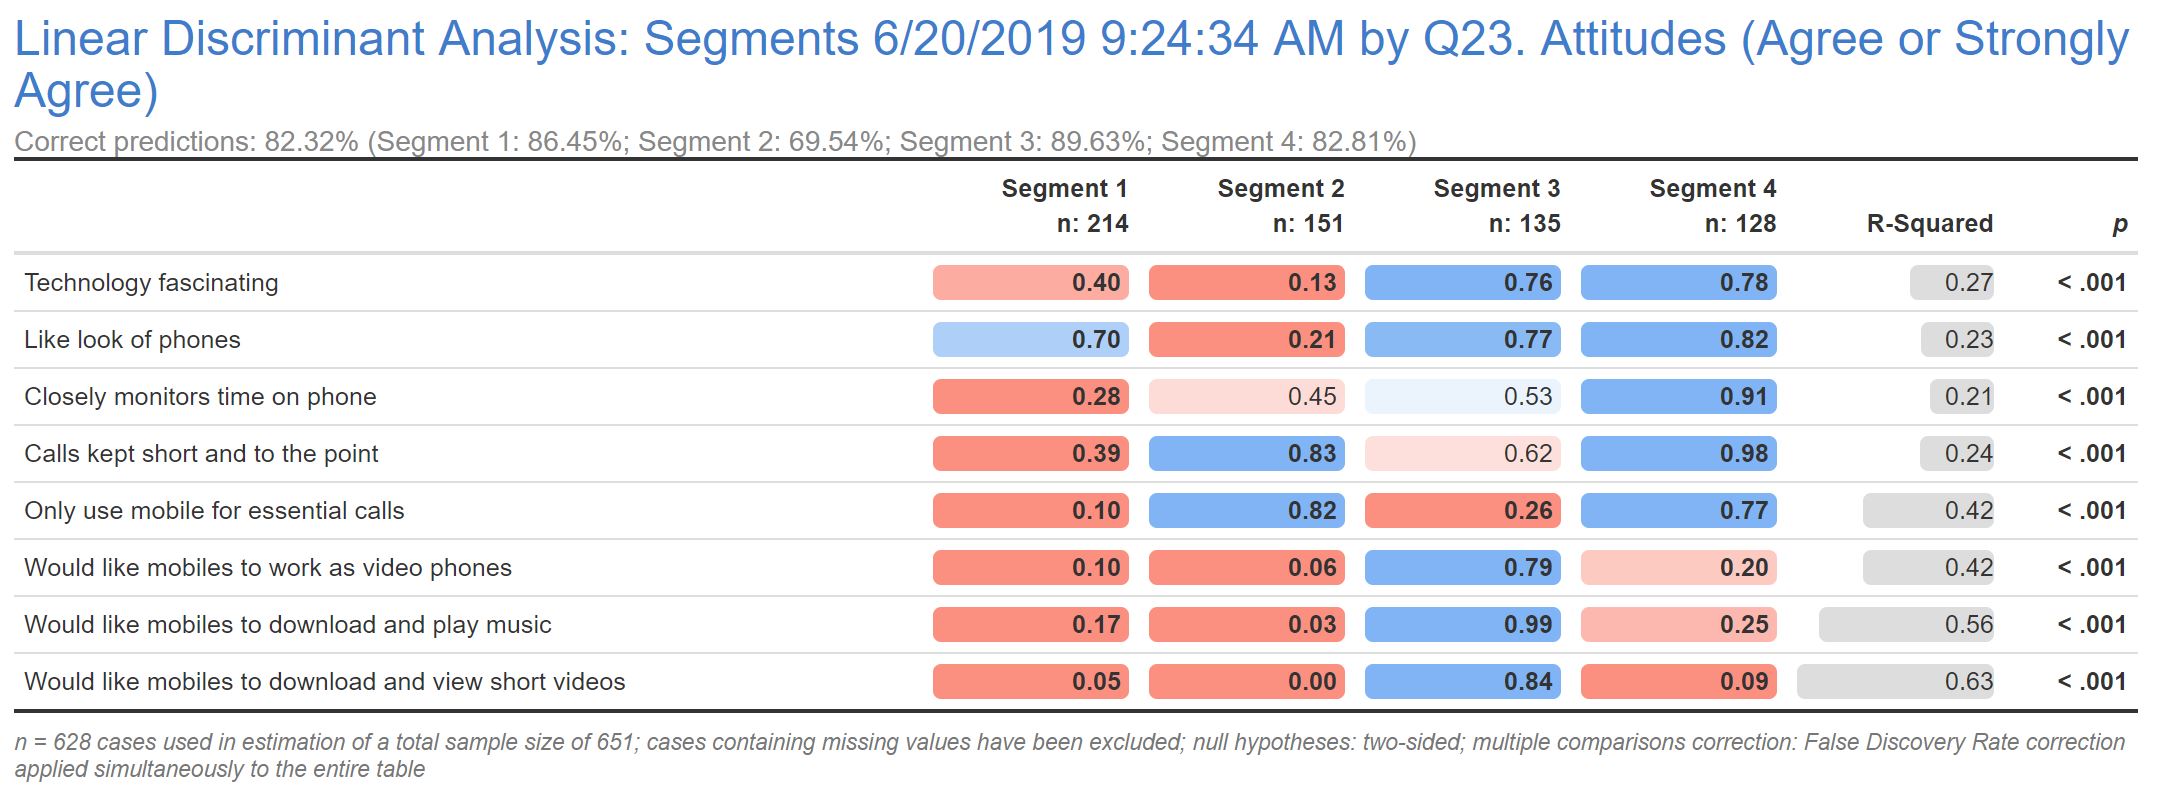
Next, I’ve run a Linear Discriminant Analysis to identify the “golden questions”. LDA is perhaps one of the simpler techniques to use for this purpose as it applies a formula that is easy to understand and program. However, it is important to note that other machine learning or predictive techniques may be used for this purpose, and may give better results in terms of accuracy (but are also likely to be more difficult to program).
In this model, I’ve identified 8 of the 25 attitudinal questions, which gives me an 82% segment prediction accuracy.
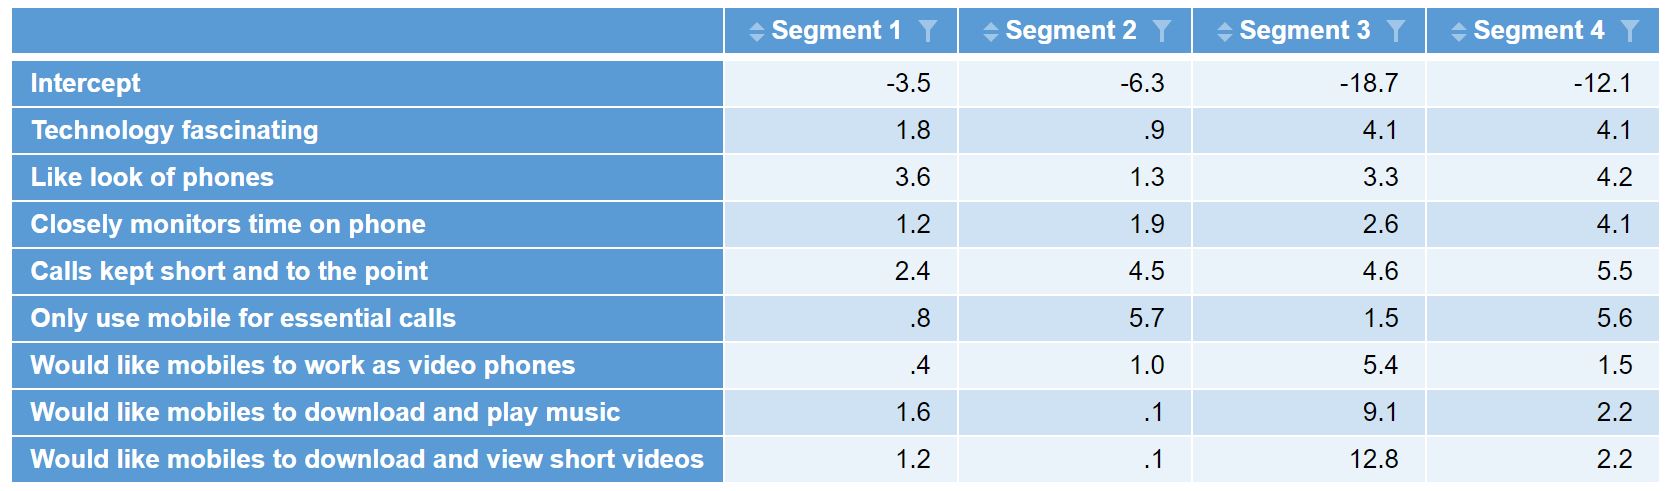
If you’ve run the Linear Discriminant Analysis in Q as I’ve done above, you can then generate the Discriminant Functions by selecting the LDA output and then from the menus selecting Create > Classifier > Diagnostic > Table of Discriminant Function Coefficients which generates the following output.
These can be easily exported to Excel if needed by simply clicking on the Excel icon in the toolbar.
To learn more about golden questions, see our article How to to write “Golden Questions” for Market Segmentation.
Segmentation Classification Algorithm
With the discriminant functions in hand, we can now formulate the classification algorithm for each segment which takes the form of:
segmentn = b + (var1 * coeff1) + (var2 * coeff2) + (var3 * coeff3) + . . . . + (varn * coeffn)
where b is the intercept, varn represents the variable response and coeffn represents the coefficients from the discriminant function.
Replicating this formula for each of the 4 segments results in a segment value for each. For example, a respondent who gave a top 2 box score for the first 4 questions but not for the second four questions would result in the following segment1 value:
segment1 = -3.5 + (1 * 1.8) + (1 * 3.6) + (1 * 1.2) + (1 * 2.4) + (0 * 0.8) + (0 * 0.4) + (0 * 1.6) + (0 * 1.2) = 5.48
If we do this for each of the 4 segments, we end up with a value for each segment. We then determine which value is the largest and assign the respondent to the corresponding segment. In this example, we find that segment 4 has the highest value, so this respondent is allocated to segment 4.
segment1 = 5.48
segment2 = 2.31
segment3 = -4.03
segment4 = 5.73
Creating the Typing Tool in Q
To be able to apply the classification algorithm in another survey, the exact same questions must be present in the new survey. We can then use a little bit of JavaScript to formulate the classification algorithm.
To create the JavaScript variable, go to the Variables and Questions tab, right-click where you want to add the segment variable and select Insert Variable(s) > JavaScript Formula > Numeric. For my example, I add the following JavaScript code into the Expression section of the JavaScript window:
var segment1 = -3.5 + (q23b * 1.8) + (q23c * 3.6) + (q23h * 1.2) + (q23l * 2.4) + (q23o * 0.8) + (q23u * 0.4) + (q23v * 1.6) + (q23w * 1.2);
var segment2 = -6.3 + (q23b * 0.9) + (q23c * 1.3) + (q23h * 1.9) + (q23l * 4.5) + (q23o * 5.7) + (q23u * 1) + (q23v * 0.1) + (q23w * 0.1);
var segment3 = -18.7 + (q23b * 4.1) + (q23c * 3.3) + (q23h * 2.6) + (q23l * 4.6) + (q23o * 1.5) + (q23u * 5.4) + (q23v * 9.1) + (q23w * 12.8);
var segment4 = -12.1 + (q23b * 4.1) + (q23c * 4.2) + (q23h * 4.1) + (q23l * 5.5) + (q23o * 5.6) + (q23u * 1.5) + (q23v * 2.2) + (q23w * 2.2);

maxSegment = Math.max(segment1, segment2, segment3, segment4);

if (maxSegment == segment1) 1;
else if (maxSegment == segment2) 2;
else if (maxSegment == segment3) 3;
else if (maxSegment == segment4) 4;
else NaN;
The first 4 lines of the JavaScript code above calculates the segment variable for each of the segments using the discriminant functions and the responses to each of the questions. The next line identifies and the largest segment value and stores it in a variable called maxSegment. The last 4 lines of code check to see which segment value the maxSegment matches and returns the corresponding segment.
We can review the Preview of results section at the bottom to ensure that the segment values are being returned as expected. Enter a Name and Label for your new variable, and click OK to save the JavaScript variable. The segmentation variable based on the classification algorithm is added to your data set. It’s a good idea to click into the Question Type column for this variable and change it to Pick One so that any tables will show the segments as categories.