

How to Blank and Cap Cells of Tables Using R in Q
After you make a table, you might like to modify the contents of the cells. Perhaps you want to make the table easier to read by removing some of the small values (which you might consider ‘noise’). Perhaps you want to ‘cap’ numbers over a certain threshold. In this post, I explain how you can modify the cells of tables made with R Outputs.
In doing so, I’ll give you some simple R code that you can adapt for your work. You don’t need to be a guru in R to do this – but this articles assumes you are familiar with the content in Simple Table Manipulations with R in Q.
Now users of Q may be familiar with Rules that can modify tables for the purposes of changing cell content. Under Automate > Browse Online Library > Modifying Cell Content, there are a few useful rules, which includes the rule Blanking Cells with Small Sample Sizes. However, you cannot apply Rules to R Outputs. Rules are made with JavaScript and do not work on R outputs. Rules can only indirectly influence an R Output (by changing a source tables which are not made with R).
For Q users, the reason for this post is two-fold. First, there a several circumstances where you may like to just modify an R Output without having to go back and change various source tables. The second, is that this post serves as a part of the training program for those wanting to develop their knowledge of R.
A general piece of code to modify cells of table
In Simple Table Manipulations with R Using Q, we covered the concept of table sub-setting. Within the square brackets [], you specify the parts of the table you want to extract (i.e. rows and columns).
Now suppose instead of specifying a list of row/column indices within the brackets, you could instead specify a condition. A condition, for example, might be table < x which means “all the cells in the which have a value less than x”. Whenever that evaluates to TRUE, we are now working with only a subset of the table. You then ‘set’ that subset to be equal to new value (using the equals sign).
table[condition] = value
So in the above general piece of R code, the table is the reference name of the table you are specifying. It can either be:
- another table in the Report (in which case it will need to be highlighted blue)
- a matrix or data frame earlier on within the same R Output (in which case it won’t be highlighted blue)
Note: In either case, you need to put in an extra line of code, which is just ‘table’. That returns the final table with the substituted values (and not just the value). This line is included as the line of code in the examples below.
How to blank cells with small values
Consider the table below, which is a grid question with lots of numbers.
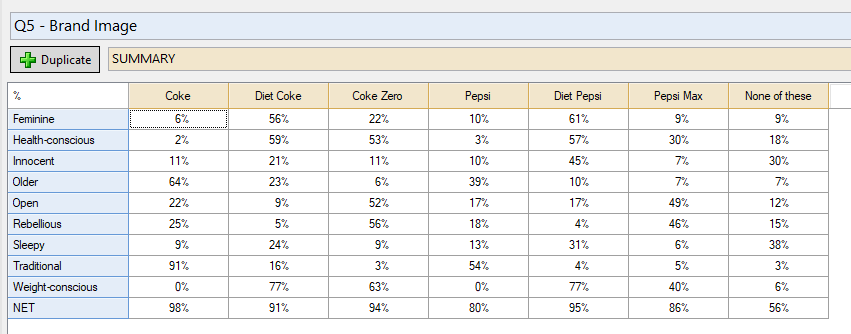
The table has the reference name (table.Q5) in the Report. With the following code in an R Output (Create > R Output), it’s going to blank all the cells with a value under 50. In the language of R, NA means blank (or missing values). By the way, this is slightly different from JavaScript which has NaN. Also, you don’t necessarily need the first line, I just include it to make line 2 look neater. I could equally have written: tab.Q5[tab.Q5 < 50] = NA
table = tab.Q5 table[table &amp;lt; 50] = NA table
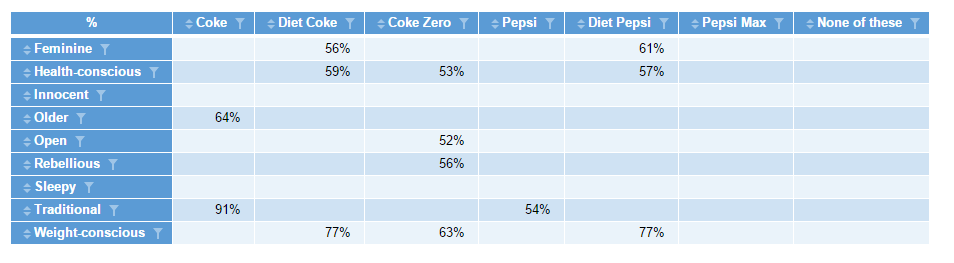
The result of the code is below. In a separate table (as an R Ouput) we now have the table form before with certain cells blanked. If you put 0 (zero) instead of NA in the code above, it would have made them all zero.
How to cap cells in a table
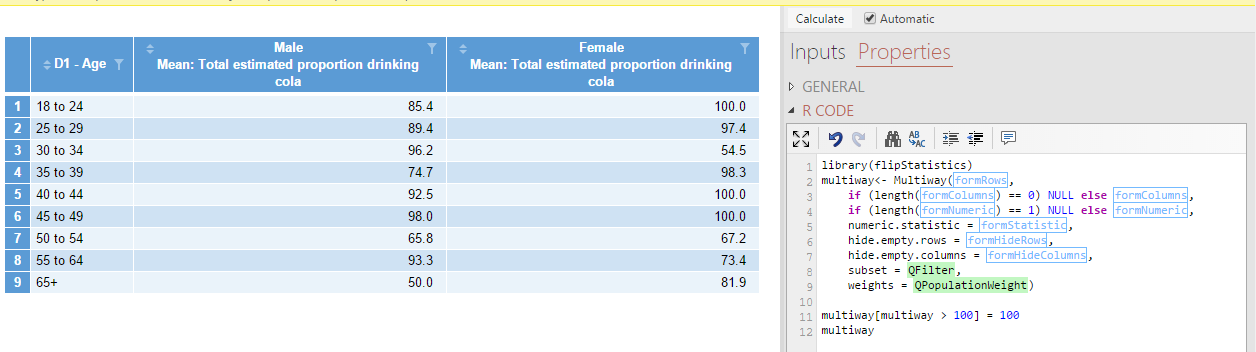
Here’s another example. Say you have a calculation and you need to cap the values in a table. In the example below, some cells are estimated to be over 100%, but you want to cap it at 100.
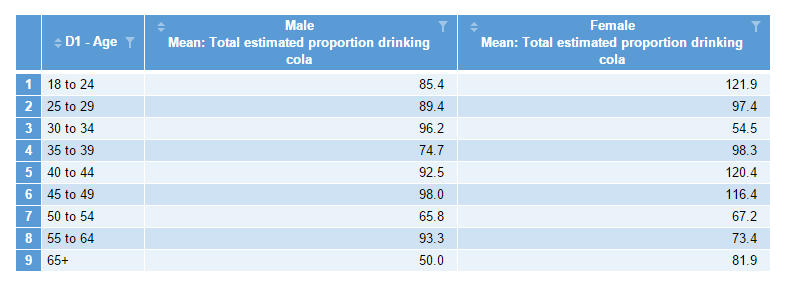
This table was created as a Multiway Table (ie: via R) using Create > Tables > Multiway Table. It’s actually already an R Output, so therefore you don’t need to make a new R Output to modify it. In this case, you can add a couple of lines of code to the existing output.
Just go into the Properties > R CODE of the Object Inspector for the multiway table to tweak it as I have below (on the right). I’ve just added two lines of code on lines 11 and 12. The key here is identifying that all the calculations from line 2 through 9 are being stored in an object called multiway on line 2.
Try for yourself
The above two examples are stored in this QPack, for you to download and explore.


