
How to Blank Cells with Small Sample Sizes using R in Q
Many researchers like to suppress statistics that have small sample sizes. This often prevents clients from making false interpretations from the data. In this post, I explain how you can automatically modify the contents of tables made within R Outputs.
In doing so, I’ll give you a simple snippet of R code that you can you borrow and adapt in your work.
Users of Q may be familiar with Rules that can modify tables for the purposes of changing cell content. Under Automate > Browse Online Library > Modifying Cell Content, there are a few useful rules, which include the rule Blanking Cells with Small Sample Sizes. Since Rules use JavaScript, they can only influence R Outputs indirectly by changing the source table(s).
However, there are several circumstances where you may like to modify an R Output without having to go back and change the source tables. Perhaps you are referencing many source tables and do not want to apply a rule to all those source tables. Perhaps you need all the data in the source tables, but not the R Output. Or perhaps you’re looking to set the values to something else (like zero) instead of a blank. With R, it’s easy to manipulate the output, as I’ll demonstrate.
Cell modification with R, a recap
In “How to Blank and Cap Cells in Tables Using R in Q“, I explained how you can modify the cells of a table in an R Output by using a condition. The condition then becomes the subset of the table you are modifying. It works like this:
table[condition] = value
In English, the square brackets specify a subset of a table. When the condition evaluates to TRUE, then we’re manipulating just that subset of the table. Using the equal sign, it sets that subset to be equal to a new value. In the case of blanking cells, that value is NA (which is used to stand for a missing value).
Note: In either case, you need to put in an extra line of code, which is just ‘table’. That returns the final table with the substituted values (and not just the value). This line is included in the examples below.
How to blank cells with small sample sizes
Now to get R to blank a table with small sample sizes, the code needs to reference the sample size for each figure. There are a couple of different ways to give this information to R. I cover one way below and describe an alternative at the end of post.
I like to have a source table that has both the values and the sample size within each cell. In the grid summary table below, I’ve specified both % and Base n as statistics.
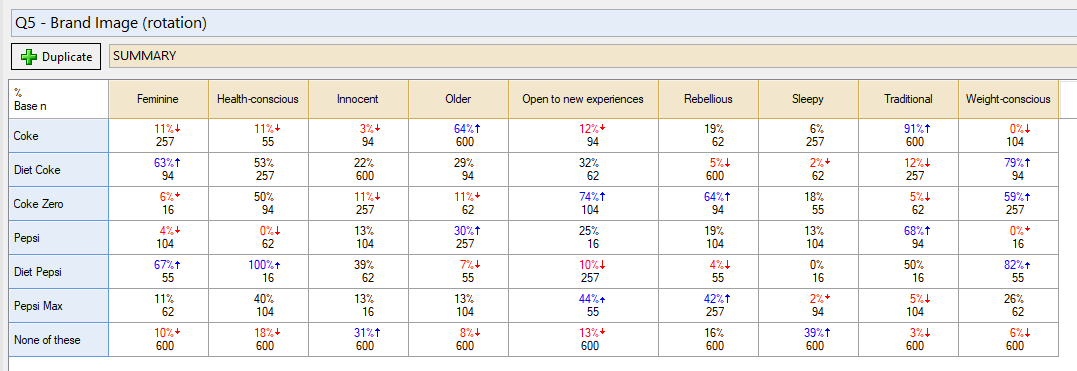
The table has the reference name (table.Q5). Then, the following code will blank all the cells with a base n less than 75.
x = table.Q5
y = 75
values_tab = x[,,"%"]
base_tab = x[,,"Base n"]
values_tab[base_tab < y] = NA
values_tab
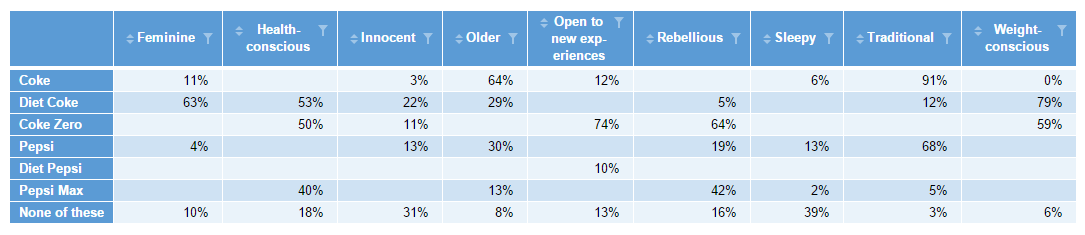
The first line is just specifying what the source table is. The second line is specifying our threshold for small sample size. The third line creates a table that only has the values (% in this case). The fourth line produces a table of just the base. This is the basis of the condition (next line). The fifth line is the key that pulls it all together. It basically says “if the base is less than the threshold of 75 in the table, then substitute the missing value (NA)”. The sixth line returns the new table of values (freshly substituted). So the end result is the below:
Adapting the code – having a separate table of values and base size
If you’re borrowing the above code, be sure that you’ve got the correct statistics in the source table. For example, the base n in a cross-tab is different from the column n. The column n is what is used to derive column-%’s. Remember, in multi-variable questions (such as a Pick Any), the base n or column n could vary by row (or column). In the worked example above, each cell in the source table was a separate binary variable (grouped into a Pick Any – Grid), so had its own base n.
You don’t have to use just one source tab. You could have the statistics in separate source tables, but you’d need to adjust the code accordingly, a bit like the below (where lines 1 and 2 refer to different tables).
values = table.Q5
base = table.Q5.base
y = 75
values[base < y] = NA
values
Be aware, that the tables need to overlap exactly in terms of the order of their rows and columns. That’s why I prefer to use just the one source table (and extract what you need from that). It’s safer.
Of course, you can fiddle with the code to produce a different outcome. For instance, you can set all the cells to 0 instead of NA if you prefer.
Try it yourself
The worked example is in this QPack, so you can see the code in action.


