


Have you been in a situation where you need to update a KPI summary, and you want everything within the one table? This is particularly handy for tracking where you can automatically pull together different bits of information into one summary table. The summary might also involve some kind of computation (e.g. taking the average of some numbers in the table). All this can be accomplished in Q – and it’s easier than you might have suspected.
To illustrate this how this is done, I’m going to create a table that represents the concept of a brand funnel (similar to a purchase funnel). The final result will look like this:
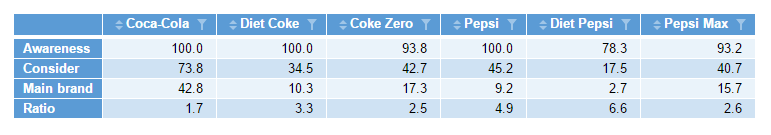
The data therein is often represented visually with the image of a funnel – as we do in this example dashboard. I have three separate questions that feed into the table: Awareness, Consideration and Preferred Cola (called Main Brand in my table above). I then calculate a Ratio as a fourth line (using the Consider figure divided by the Main figure for each brand).
You could potentially apply the procedure to any KPI summary or creation of a brand index. It just involves a bit of simple R code with the application of some basic logic. In this post, I’ll explain step by step how I made the above table. The key steps we’ll go through are:
- Setting up your source tables
- Creating an R output
- Collating reference names
- Writing some instructions (in code)
- Organising your work
For that reason, I’ve broken up the fourth step above into bits to show you how it works, line by line. As a result, this post also serves as an introduction to working with R to those who are new to it! (Don’t worry, it’s not THAT scary).
Setting up your source tables
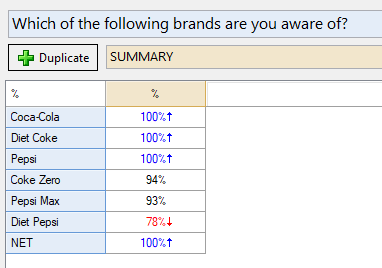
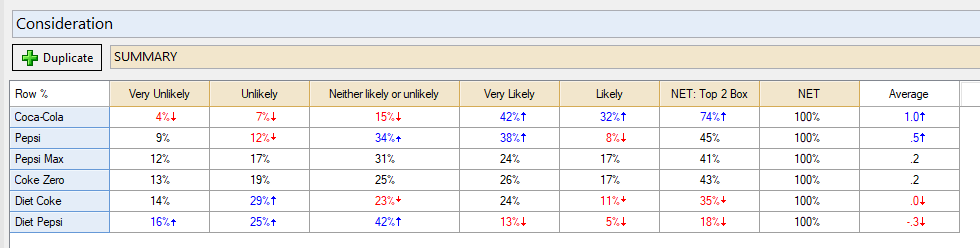
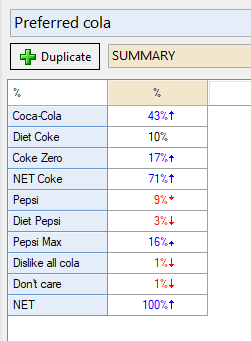
The easiest way to create the figures we need are with the usual tables in Q. We later reference certain cells within those tables and rearrange them in the final summary table. For the worked example, I created three tables upfront, shown below (and available in the QPack here):
Creating an R output
The summary table (brand funnel) in the example looks different to my source tables above. That’s because it is a special type of table: an R Output. A table in an R output has the following features worth noting:
- It updates automatically based on any changes to its input (source) tables. As an example, if we’re in a tracking situation and we update our Q Project with new data, then this summary table automatically updates
- It exports to Excel or PowerPoint in the usual way
- You can use an R table as a source table for visualizations and other advanced analyses (e.g. correspondence analysis)
- You can still use the decimal places and % buttons in the toolbar at the top at the top of the Q window
- R outputs do not retain the significance testing that you see in normal Q tables
- You cannot apply the functions from the Automate menu to R tables
An R table is created by making an R Output and typing some code. To do this in Q, we simply go to the Create menu and select R Output.
You can then type in your R code in the Object Inspector on the right-hand side. Try typing in just the number 1 and pushing Calculate. It should return just the digit 1 in the output area (in the middle of screen).
Then you could try typing 1 + 1 and pushing Calculate. It should return… *drumroll*… 2! Easy.
For now, make sure the Automatic toggle box is deselected (otherwise the code will recompute every time you type something in). We can set it to automatic later, after we’ve finished the code.
Some very basic R
Now try typing: c(“Coca-Cola”,”Pepsi”,”Fanta”,”Pepsi Max”)and pushing Calculate.

That should return the below as an output.
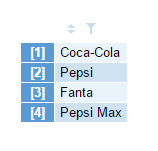
The little c together with the brackets is known as a function. In this case, the function c() combines whatever is in the brackets into a vector. I had to put the double quote marks “” around each brand so that the R code knows that I’m talking about text (and not referring to other variables!). In programming speak that makes each of these brands a string. The comma in between each string tells R that they are separate items.
You can then store the vector as a variable – so you don’t need to type it all again later! Let’s store it as a variable called brands. Then later we could recall the 3-string-vector just by typing brands. Putting the code together for all this looks like the below:
brands = c("Coca-Cola","Pepsi","Fanta","Pepsi Max")
R works from top to bottom, line by line on the code. The last thing in the list is what ends up in the output area. Thus, if you type in:
brands = c("Coca-Cola","Pepsi","Fanta","Pepsi Max")
1+1
You’ll get 2 as an output. But if you type in the below, including the 3rd line, you’ll get our vector of brands as the output!
brands = c("Coca-Cola","Pepsi","Fanta","Pepsi Max")
1+1
brands
We can take this a step further and reference a specific item within a vector. In the case of our brands vector, I might want the 2nd item. So I could add a [2] to the brands on the last line:
brands = c("Coca-Cola","Pepsi","Fanta","Pepsi Max")
1+1
brands[2]
And that will return… Pepsi! Try it.
Furthermore, I can reference multiple things by typing the following – in this case returning the 2nd to the 4th item in brands (including the 3rd)
brands[2:4]
And then, just for fun, I could do the following to mess with the brand order, for example:
brands[c(1,4,3,2)]
Referencing the source tables
R, when used in Q, can bring in data from tables (and variables) in your project. Our first step in building our brand funnel is to get all the reference names for all the tables that we want to use. What you see in the Report Tree in Q are the table names. R, however, is interested in a reference name which is slightly different.
To find the reference name for a table, you can right-click the table in the Report tree and select Reference Name. The reference names are often long-winded, because they are generated automatically from the table name. For instance, our first table on brand awareness the full reference name is table.Which.of.the.following.brands.are.you.aware.of. To make it a bit more shorthand, change the entry to aware_tab, and click OK.
I do this for the other tables as well so that I have: aware_tab, consider_tab, main_tab
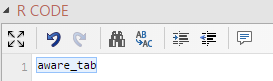
With that bit of housekeeping done, I can reference these tables in my R output. If you enter one of those reference names it will return the entire table. Try typing in aware_tab into the R CODE input box on the right and click Calculate. You will get an output that displays the same numbers from the original awareness table.
When the item in the code highlights in blue it means it is successfully referencing an output in the Q project. If you hover your mouse over the blue highlight, it should then pop-out an tool-tip showing the source table for your reference.
Important: R (like all programming languages) is very specific about spelling, punctuation (including spaces at the end of words) and is CaSE-sEnsItiVe. Whatever you put into the code has to be exact.
Referencing a specific cell in the source tables
Next, we will reference individual cells, rows, or columns within a table. This is called subsetting which uses indices to find the positions in the table that you want to extract. It’s a simple concept – in fact, we’ve already worked with subsets and indices when we selected which brands to show from brands.
To return a specific cell, use its index. This is what we did above when we typed in brands[2]. But we’re now dealing with tables, so we have some different options. If I want to return the statistics of Preferred Cola for Diet Coke, I can do so by typing main_tab[2] and that will return 10.3 (ie: 10%). That’s because I referenced the figure in second position (index) in the Preferred Cola table.
That’s all well and good, but what if my source table changed? If I add in a NET Coke line to my source table and move that to the top of the table then Diet Coke shifts down. It’s now, instead, in third position, and my result is no longer correct.
Instead, we can reference the data using the row name (category name), which in our case is the brand name. That way, it’s impervious to any changes in position within the source table. To do so, I just replace the number 2 with some text within double quote marks “”. In this case, it’s:
aware_tab["Diet Coke"]
That returns 10.3. Try dragging and dropping the categories in the source table to change their order and then click Calculate again in the Object Inspector of your R object. The referencing is now secure (in terms of position).
Again, much like referencing tables, you need to be exact in referencing categories within tables. That means that “Coca-Cola” does not equal “Coca Cola”, or indeed “Coca-Cola “. Can you spot the difference in the last one? There is a rogue space between the end of Cola and the last full stop! That’s important.
Referencing lots of cells at once in the source tables
Now we can reference lots of brands at once, by using a vector as the index (rather than just one number or text label). The benefit is that I’m always referencing brands in the same order and I don’t have to worry about position of brands in my source tables. For that reason, I’m going to set up a vector of brands as the following.
brands = c("Coca-Cola","Diet Coke","Coke Zero","Pepsi","Diet Pepsi","Pepsi Max")
I’m then going to use this to reference all the brands in the Awareness table but using brand as the index within the square brackets. So it’s:
aware_tab[brands]
which is essentially identical to me writing:
aware_tab[c("Coca-Cola","Diet Coke","Coke Zero","Pepsi","Diet Pepsi","Pepsi Max")]
… but a lot neater! I don’t have to keep repeating the brands once I’ve combined it all into the variable brands.
If you now return aware_tab[brands] you’ll get all the awareness figures from the source table in the desired order. Let’s store that as another variable called aware as the second line of our code:
brands = c("Coca-Cola","Diet Coke","Coke Zero","Pepsi","Diet Pepsi","Pepsi Max")
aware = aware_tab[brands]
Now in the second source table, consider_tab, I want the figures from the Top 2 Box column. This table is slightly different to the first table. It’s a matrix (because it has rows and columns). Because of this, I need to reference both row and column co-ordinates with my indices, separated by a comma. Think of it as a bit like battleships! To obtain the Top 2 Box scores for each of the brands, that would be:
consider = consider_tab[brands,"NET: Top 2 Box"]
Finally, as with the aware table, I also grab the data from the main brand table and place that into a variable called main:
main = main_tab[brands]
Now that I have the data from my three tables stored into separate variables, I can combine them together using the function cbind(). Here, the c stands for column, and the bind part is descriptive in that it binds the referenced vectors together. This will output a table where each column is one of my variables, and each row represents a brand:
table = cbind(aware, consider, main)
Notice that I’ve stored this as a variable called table. Again, it’s just short-hand so that I can reference the entire thing later. Try pushing Calculate. And voilà! It’s made the summary table!
But the names of the columns are just the variable names. I could in fact give them proper titles, so let’s do that by adding in the following to the code to make the columns a bit more descriptive.
table = cbind("Awareness" = aware, "Consider" = consider, "Main brand" = main)
In this line of code, I’m saying that a new column called Awareness should filled with aware, and then next to that a column called Consider should be filled with consider, etc.
Finally, I’m going to transpose it so that it looks like a funnel with Awareness on top. To do so, I use the transpose function t() and I store that as funnel.
funnel = t(table)
The brand funnel is almost done!
Calculating the ratio of consideration and main brand scores
Now that we have our summary table, I’m going to add one final line below it. This will create a ratio between the Consider line of the summary table and the Main brand line. To do so I’m going to reference data in the summary table itself rather than the source tables. As I’ve saved that using the reference name funnel, I’ll reference the Consider line by writing the following.
funnel["Consider",]
The funnel variable won’t highlight in blue, because it’s not in the outputs area. It’s a vector that’s local (ie: inside) the R output. Also notice in the above that I’ve left nothing to the right of the comma. That’s because I’m saying, in R, that I want all the columns please (i.e. I’ve skipped specifying a column or columns). But I only want all the columns for the rows called “Consider”, so we need to subset our table again to get a specific slice of my table.
The ratio I’m after is a division of this slice by the corresponding figures in the Main Brand row. The code for the ratio is going to be the following (which I’m storing in a vector called ratio).
ratio = funnel["Consider", ] / funnel["Main brand", ]
We’re nearly there! I’m now going to add this ratio line in to the summary table, this time using rbind() (which stands for “row-bind”) and calling the new line Ratio.
funnel = rbind(funnel, "Ratio" = ratio)
Finally, you’ll notice that in the above, I’m writing the new funnel (including the ratio) over the top of itself. I’m allowed to do that! This changes the variable funnel. As it’s the last line, this is returned as the output.
The final, complete block of code is relatively straight-forward:
brands = c("Coca-Cola","Diet Coke","Coke Zero","Pepsi","Diet Pepsi","Pepsi Max")
aware = aware_tab[brands]
consider = consider_tab[brands,"NET: Top 2 Box"]
main = main_tab[brands]
table = cbind("Awareness" = aware, "Consider" = consider, "Main brand" = main)
funnel = t(table)
ratio = funnel["Consider",]/funnel["Main brand",]
funnel = rbind(funnel, "Ratio" = ratio)
Organizing your work
Now we can organise our work. Having the reference names means we can move about our source tables in the Report tree – the links will still be retained. Likewise we could add categories to the source questions but the summary table should not change. Here are some good-practice things I recommend.
First, ensure your brand funnel R output is set to Automatic by clicking the button next to the Calculate button. This means the R output will update automatically if the source values change in any way.
Second, tuck your source tables into a sub-folder. To do this, just right-click on the Report Tree and select Add Folder. Then move your source tables into this folder. Give your folder a appropriate name (e.g. “Brand funnel source tabs”).
Third, lock your source tables – right-click and select Lock. Note that this only protects the table from accidental changes (like putting on a filter or changing the statistic in the cells or inadvertently changing the blue or brown question).
The only thing we can’t do is rename the categories of the questions you use in your source tables. For instance, I can’t rename Coca-Cola to Coke in my source tables as it will break the referencing system I have set up. The summary table will then throw an error and you’ll either have to change your source tables, or change your code accordingly. If you’re worried you may inadvertently change the questions in your source tables, perhaps consider duplicating your question(s) first and give it a warning suffix to the question name like “ – do no change!” or “– for R computations”.
With that done, why not try:
- updating your datafile with fresh data to watch your brand funnel automatically update. For instance, you can update the data file in the example QPack with the file Cola Tracking – January to December.sav which should be in your Examples sub-folder in your Q program directory on your hard-drive
- hooking up your R output to another analysis, like a visualization
- exporting your summary table to Excel and/or PowerPoint directly
Try it yourself
All the data and working involved in this post is stored in this QPack here. We encourage you to download it and try it. If you don’t have a copy of Q, you can request a free trial here.


