How to Build Tables that Automatically Show Results from the Latest Period
If you are running a tracking study you may want to have tables which focus on results just from the latest month or quarter. A little-known fact about Q’s binary filters is that they can understand the months and weeks in your data, and automatically work out which people are in the latest period. When you update your tracker with the next set of data, the filter will adjust itself to show the new results from the latest period. You don’t need to re-make the variable!
In this article, I’m going to take you through a few handy examples that will let you build tables for specific periods which always stay up to date. I’ll look at creating three different filters, one which includes respondents from the last 4 weeks, one for the previous 4 weeks and one that combines them with a filter for the previous 12 weeks. I’ll use these to build customized summaries of my key results for these three key reporting periods. For these examples, I’ll be working off a project that tracks key results for different burger chains.
You’ll Need a Date Variable
In order to take advantage of this particular technique you need to have a Date variable in your data set. A Date variable is a special type of variable which stores the date for each person’s response. This is often when they completed the survey, but it could be any date associated with the respondent (e.g. date of last flight, date of most recent purchase, etc).
Date questions look like this in Q:
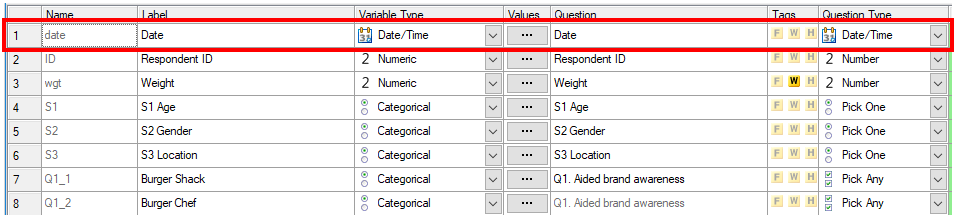
If your date looks like this, then it is set up and ready to go!
Sometimes, your Date may appear as a Text variable. If this is the case, then click into the Variable Type column, and change it to Date. Q will interpret the text as real data values and create a new Date variable for you.
In other cases you might not have a real Date variable in the dataset. Instead, you might have variables which have categories for months, quarters, or waves. In this case it is possible to use JavaScript to create new date values that correspond to those categories. For more info, check out our Wiki.
Now I’ll move on to show you how dates interact with Q’s Binary – Complicated Filter tool.
The last 4 weeks filter
To start, we need to create a new binary filter. Select Create > Variables and Questions > Variables > Binary – Complicated Filter. Don’t let the name scare you – they don’t have to be complicated, but they can satisfy complicated requirements if you need them to! Here is what the filtering tool offers when you select a Date variable in the Variables and Questions section:
![]()
The options are:
- Within last period – this is the option I will use to select people in the last 4 weeks
- Equals / Not equals – identify respondents from a specific date, or who are not from a particular date
- Greater than / Less than – use these to identify respondents whose dates fall within a particular range
These conditions can be used in combination, with each other, via AND and OR operations in order to customize the range of respondents that will be included.
In the screenshot above I have used the key option that I want to highlight on this post – Within last period. This option identifies the last period by referencing the the most recent date among any that are in the data set. So by selecting 4 Week, Q has identified the calendar week in which the latest respondent falls, and it works backwards from there to identify the set of 4 most recent weeks. The same applies if you want to identify respondents in the last 6 months, 1 quarter, and so on.
And that’s all there is to it! The only other selections I have made are to assign a Label and a Name so that I can identify the meaning of the variable later on. This filter may be applied to any table (or other output) to show results for people who completed the survey in the last 4 weeks.
The previous 4 weeks filter
Next, I would like to be able to compare results for respondents from the last 4 weeks with the previous 4 weeks. To do that I just need to apply a little logic. To find people from the previous 4 weeks, I need to identify people from the last 8 weeks who are not also from the most recent 4-week period.
- Select Create > Variables and Questions > Variables > Binary – Complicated Filter.
- Select the Date variable in the Variables and Questions section.
- Choose Within last period under Contains.
- Change the Date/Time option to 8 Week.
- Press the AND button at the top. This places AND above the filter condition. Any other conditions which are nested below this AND will be grouped together as an AND relationship, meaning that only respondents who satisfy all of them will be included.
- Press the + button at the top to create a new condition below the first.
- Change the Date/Time selection to 4 Week.
- Press the NOT button at the top. This reverses the condition so that it excludes anyone from the last 4 weeks.
- Enter a Name and Label and click OK.
My setup looks just like this:
![]()
Joining them all together
As mentioned above, these filters can be applied to any table to see results from that period. But what if you want to show these results side-by-side? You can do that by grouping these filters together as a Question. This can then be used in any crosstab.
I’ve gone ahead and also made a filter for people in the last 12 weeks (using the same process from the first section), because that’s another category that my client wants to see in the report. My variables appear like this in the Variables and Questions tab:
![]()
To group them together:
- Highlight all the rows as I have done above.
- Right-click and choose Set Question. This is the option to use whenever you want to group variables together.
- Make sure the Question Type is Pick Any. Q should have this selected for you already.
- Enter a Name, like “Key Reporting Periods” and click OK.
- Q will now pop up the Value Attributes window. Check that it looks like the one below, and click OK.
![]()
For multiple-response data or binary data like this, the Value Attributes is where you choose which categories will counted in the table. In this case Q will count everyone who is in the “Selected” category for each filter (i.e. those people who are included in the filter).
After grouping, the variables the should appear like this:
![]()
You’ll notice in the Tags column that they are no longer highlighted as filters. If you want to also use these for filtering, just click one of the little yellow ‘F‘s here.
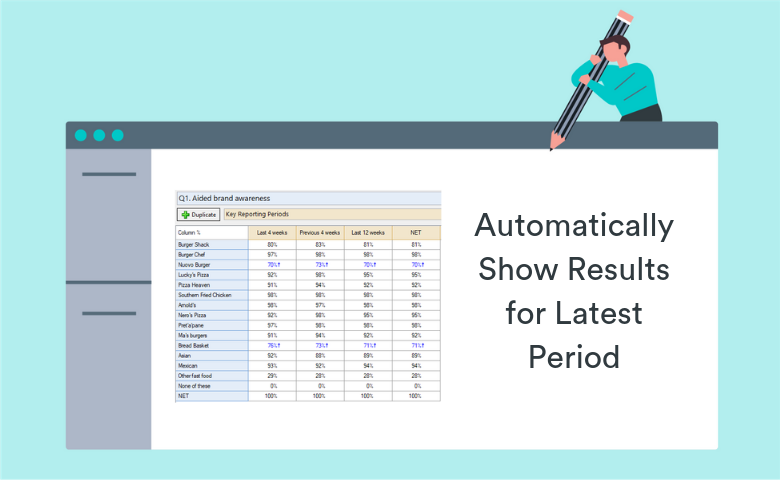
If I use this in the Brown drop-down menu on my table, I get the results from my key periods at a glance.
![]()