

How to Calculate an Average Value from Categorical Data in Q

The traditional means for outputting categorical data is with percentages representing each category’s share of the total sample. However, there are a range of cases where it is useful to calculate an average value based on the categories. This requires that each category in the data be associated with a meaningful value – making our average, well, also meaningful.
Recoding
In calculating an average value for a categorical question, a numeric value must be assigned to each category. For some numeric questions, researchers often utilize categorical, single-response options with numeric range labels rather than ask respondents to enter a specific value as a response to a question. For example, researchers commonly ask the respondent’s age as a categorical value range instead of as a numeric question.
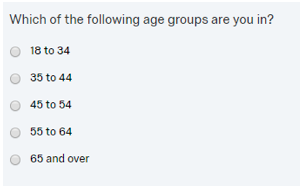
In order to calculate an average in this situation, a numeric value must be assigned to each category that best represents the entire category. The way to achieve this is with midpoint coding. This process codes the value for each category with its midpoint with the limitation that this average will only be an estimate or a “ballpark” value.
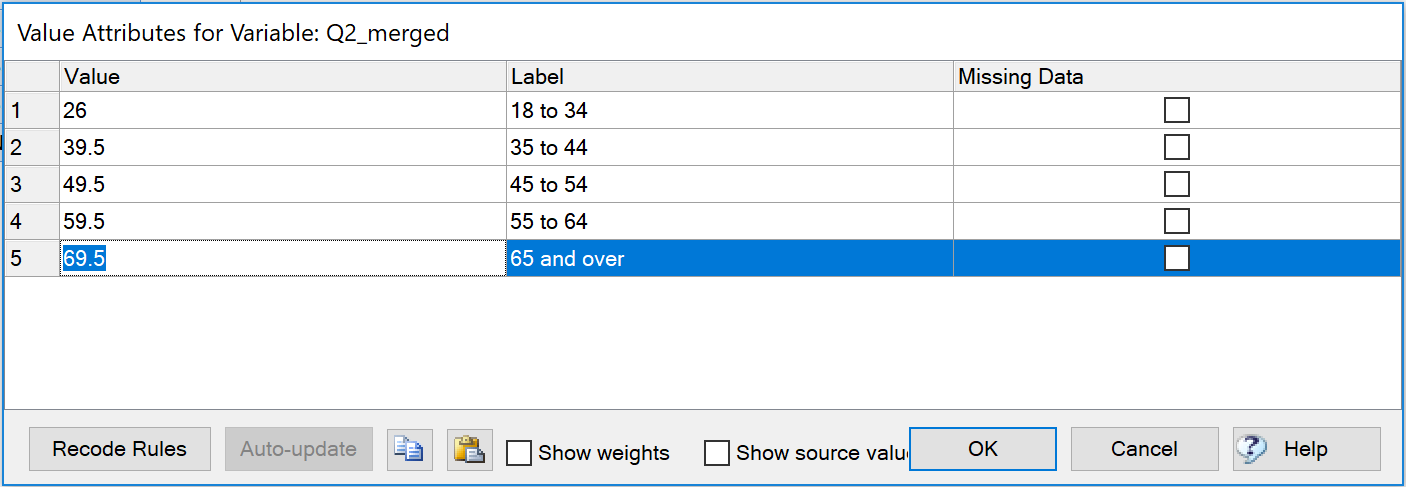
To recode values in Q:
- Right-click on the labels in a table and select Values.
- Enter appropriate values for each category in the Value column.
- Click OK.
In some cases, each category will have predefined numerical values like scale questions. See the following satisfaction question which a researcher has coded with 5 for “Extremely satisfied”, 4 for “Satisfied”, and so on.
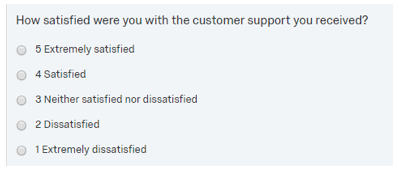
It is easy to average the results for this question. The closer the overall average is to 5, the higher the level of satisfaction. Using the average also allows for easy crosstab comparison of sub-groups. You can apply this approach for virtually any scale-type question.
Showing averages on categorical tables
Once these settings have been confirmed, you can add the average statistic to the bottom of the table by right-clicking on the table and choosing Statistics – Below > Average.
Changing the question type
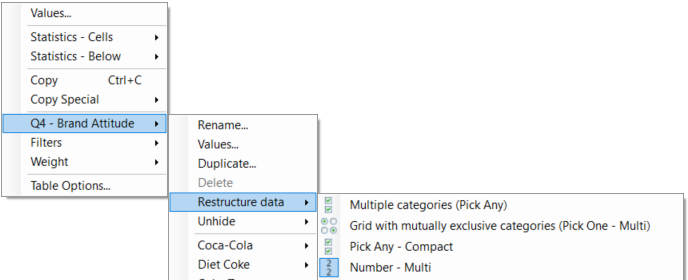
If the only statistic you want to show on a table is the average, changing the Question Type into either a Number or Number – Multi format can be a more sensible and direct option. By default, Q will always output the average statistic on tables utilizing these question types. Changing the Question Type makes it much easier to create crosstabs when comparing results for multiple items.
To do so:
- Right-click on a table showing your question.
- Find the name of the question in the context menu.
- Select Restructure Data > Average (Number) (or Averages (Number – Multi) when there is more than one variable).
Automated solutions
In addition to these practical solutions, Q’s Online Library includes automated solutions to apply these changes on a larger scale.
The Recoding – Midpoint Coding and Quantification feature automatically recodes variables according to numbers contained in their labels. To get a new value, Q will use a single number or numeric value from the label. In this example, Q has used the numbers from each label as values and has assigned any labels that don’t contain numbers, a value of NaN. This will exclude them from contributing to the computation of any numeric statistics like Average or Sum.
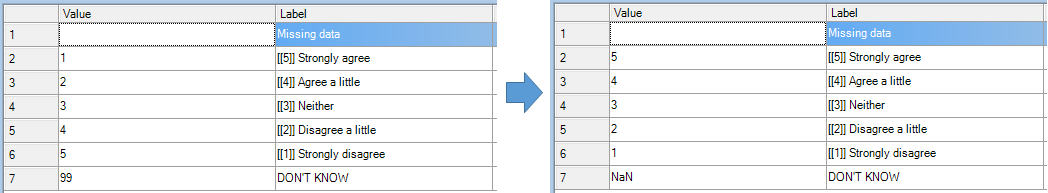
If the label contains a range of values the mid-point between the two values will be used.
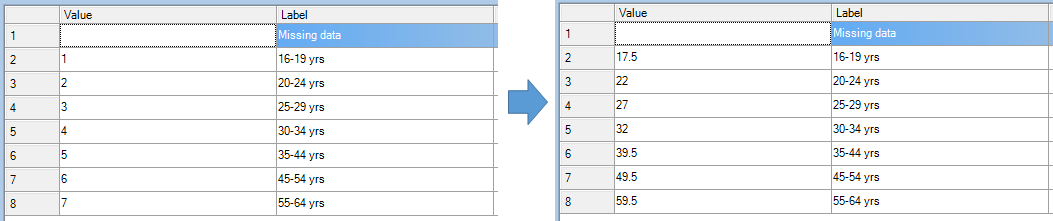
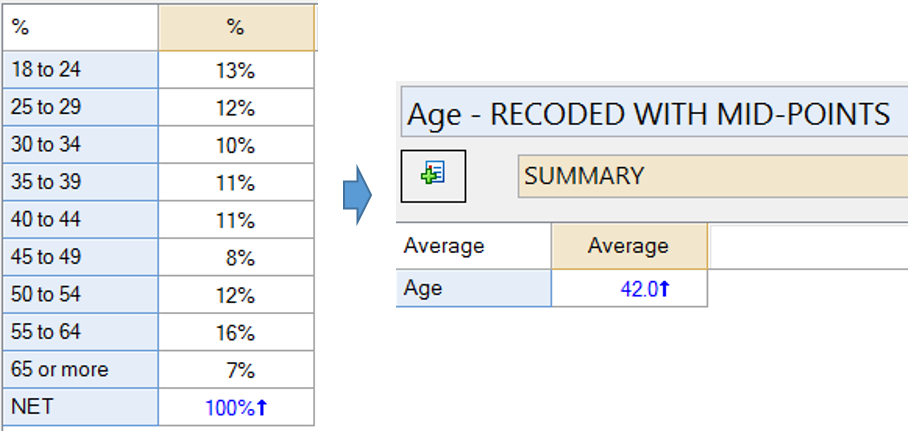
The Create New Variables – Midpoint Coding and Quantification feature completes the same process, automatically recoding variables according to the numbers contained in their labels, but it takes the extra step of generating new numeric variables with this data. It follows the same logic wherein Q will assign the same value as labels that contain a single number and a midpoint value for labels that contain a range of numbers. If no number is detected in the label Q will assign the value of NaN.
We hope you found this article on calculating average values helpful. Check out the “Using Q” section of our blog for more tips and tricks!


