How to Calculate Jaccard Coefficients in Q Using R

Jaccard coefficients, also know as Jaccard indexes or Jaccard similarities, are measures of the similarity or overlap between a pair of binary variables. In Q, this can be calculated for variables in your data easily using R.
One way of measuring the overlap or similarity between the data in two binary variables is to use a Jaccard coefficient. The coefficient ranges between 0 and 1, with 1 indicating that the two variables overlap completely, and 0 indicating that there are no selections in common. In this post I show you how to do the calculation in Q using R, by looking at how people’s preferences for confectionery flavors overlap according to their responses to a survey.
The Jaccard coefficient
The Jaccard coefficient for two variables is defined as the number of cases where both variables are equal to 1 (called the “set intersection”), divided by the number of cases where either of the two variables is equal to 1 (called the “set union”). The formula for the Jaccard coefficient for two variables, A and B, is

The top part counts the number of cases for which both variables are 1, and the bottom part counts the cases for which either variable is 1.
The coefficient can be understood in terms of a Venn diagram. As a basic example, consider a survey question which asked the respondents of the survey to select which flavors of confectionery they would purchase. We may want to know the overlap between people who said they would purchase peppermint and spearmint. The Venn diagram for these two variables (which you can create in Q by selecting Create > Charts > Visualization > Venn Diagram, selecting your Variables, and clicking Automatic), looks like this:
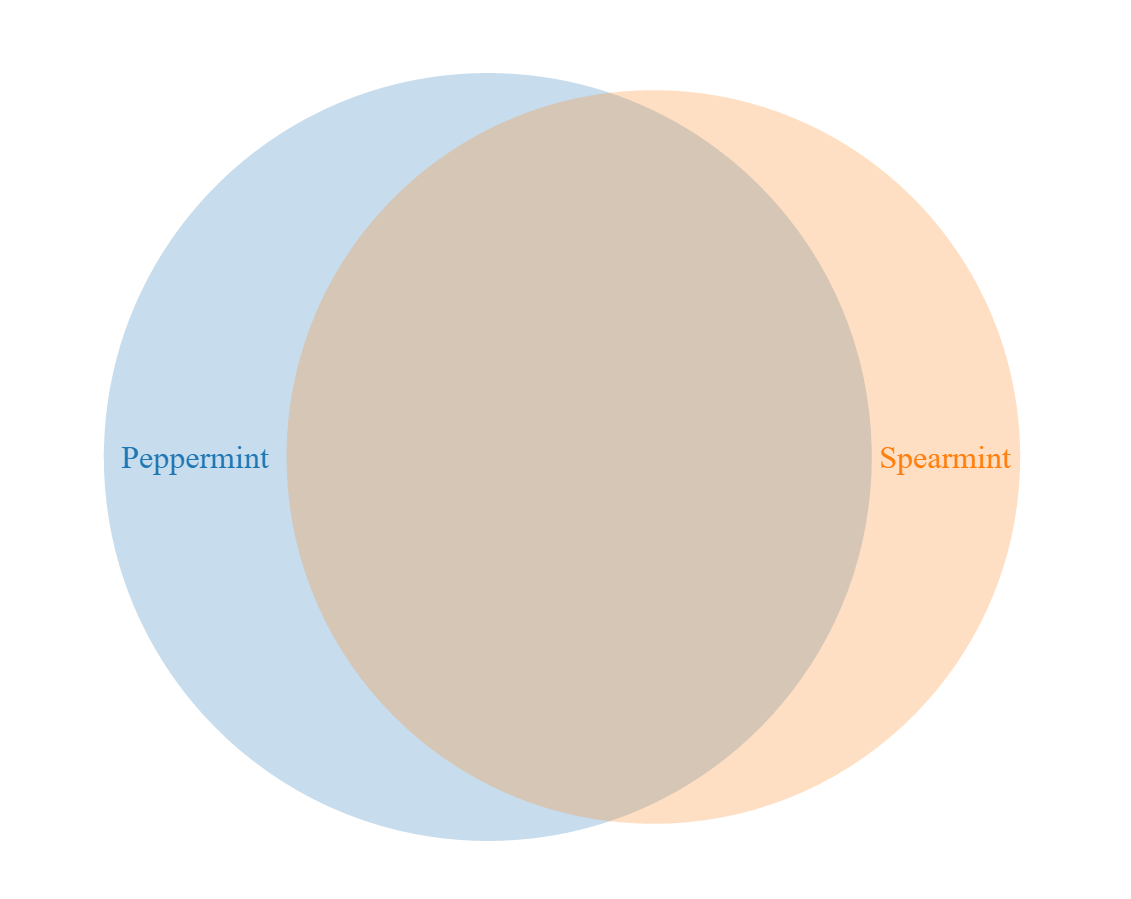
There is a substantial degree of overlap. The Jaccard coefficient is the number of people in the overlapping area in the middle of the diagram, divided by the total number of people represented by the colored area. In this case the answer is 0.56.
On the other hand, the Venn diagram for flavors Intense Peppermint and Watermelon looks like:
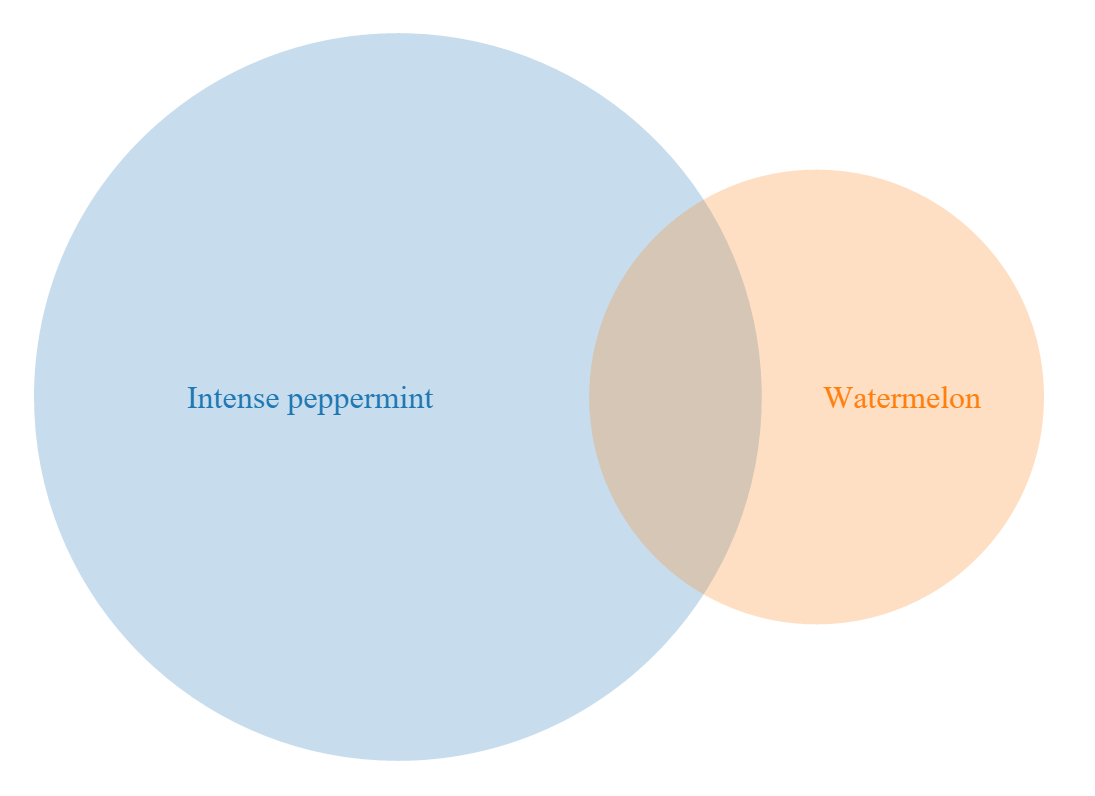
The proportion of the total area represented by the overlapping segment is much smaller. The Jaccard coefficient is only 0.09.
Data setup
The variables for the Jaccard calculation must be binary, having values of 0 and 1. They may also include a missing value, and any case with a missing value in each pair will be excluded from the Jaccard coefficient for that pair.
In Q, this means that your variables must come from a Number, Number – Multi, or Pick Any question. You can check and change the Question Type by looking in the Question Type column of the Variables and Questions tab.
Doing the calculation using R
To calculate Jaccard coefficients for a set of binary variables, you can use the following:
- Select Create > R Output.
- Paste the code below into to the R CODE section on the right.
- Change line 8 of the code so that input.variables contains the variable Name of the variables you want to include. The variable Name is the entry in the Name column of the Variables and Questions tab.
- Click Automatic.
The code for the Jaccard coefficients is:
Jaccard = function (x, y) {
    M.11 = sum(x == 1 & y == 1)
    M.10 = sum(x == 1 & y == 0)
    M.01 = sum(x == 0 & y == 1)
    return (M.11 / (M.11 + M.10 + M.01))
}

input.variables = data.frame(Apple, Intensepeppermint, Lemon, Menthol, Orange, Peach, Peppermint, Spearmint, Strawberry, Vanilla, Watermelon)

m = matrix(data = NA, nrow = length(input.variables), ncol = length(input.variables))
for (r in 1:length(input.variables)) {
    for (c in 1:length(input.variables)) {
        if (c == r) {
            m[r,c] = 1
        } else if (c > r) {
            m[r,c] = Jaccard(input.variables[,r], input.variables[,c])
        }
    }
}

variable.names = sapply(input.variables, attr, "label")
colnames(m) = variable.names
rownames(m) = variable.names

jaccards = m
In this code:
- I have defined a function called Jaccard. The function takes any two variables and calculates the Jaccard coefficient for those two variables. A function is a set of instructions that can be used elsewhere in the code. Particularly for more complicated blocks of code, writing a function like this can make your code more efficient and easier to read and check for mistakes.
- input.variables contains a data frame which has each of the variables you want to analyze as the columns.
- Initially, I have created a matrix full of missing values as a place to store my calculations.
- I have used two for loops to go through and calculate the Jaccard coefficients and fill up the top half of the matrix.
- The bottom half of the matrix is left empty. In Q, missing values are displayed as empty cells. As the bottom half of the matrix would be identical to the top half, empty cells help us to read the results more easily.
- I have used the sapply function to obtain the labels for each variable so that they may be displayed in the row labels (rownames) and column labels (colnames) of the table. In this case, sapply is using the attr function to obtain the label attribute of each variable. As R does not recognize the same set of meta data for each variable, Q adds the meta data to the attributes of the variables so that it may be returned later if necessary.
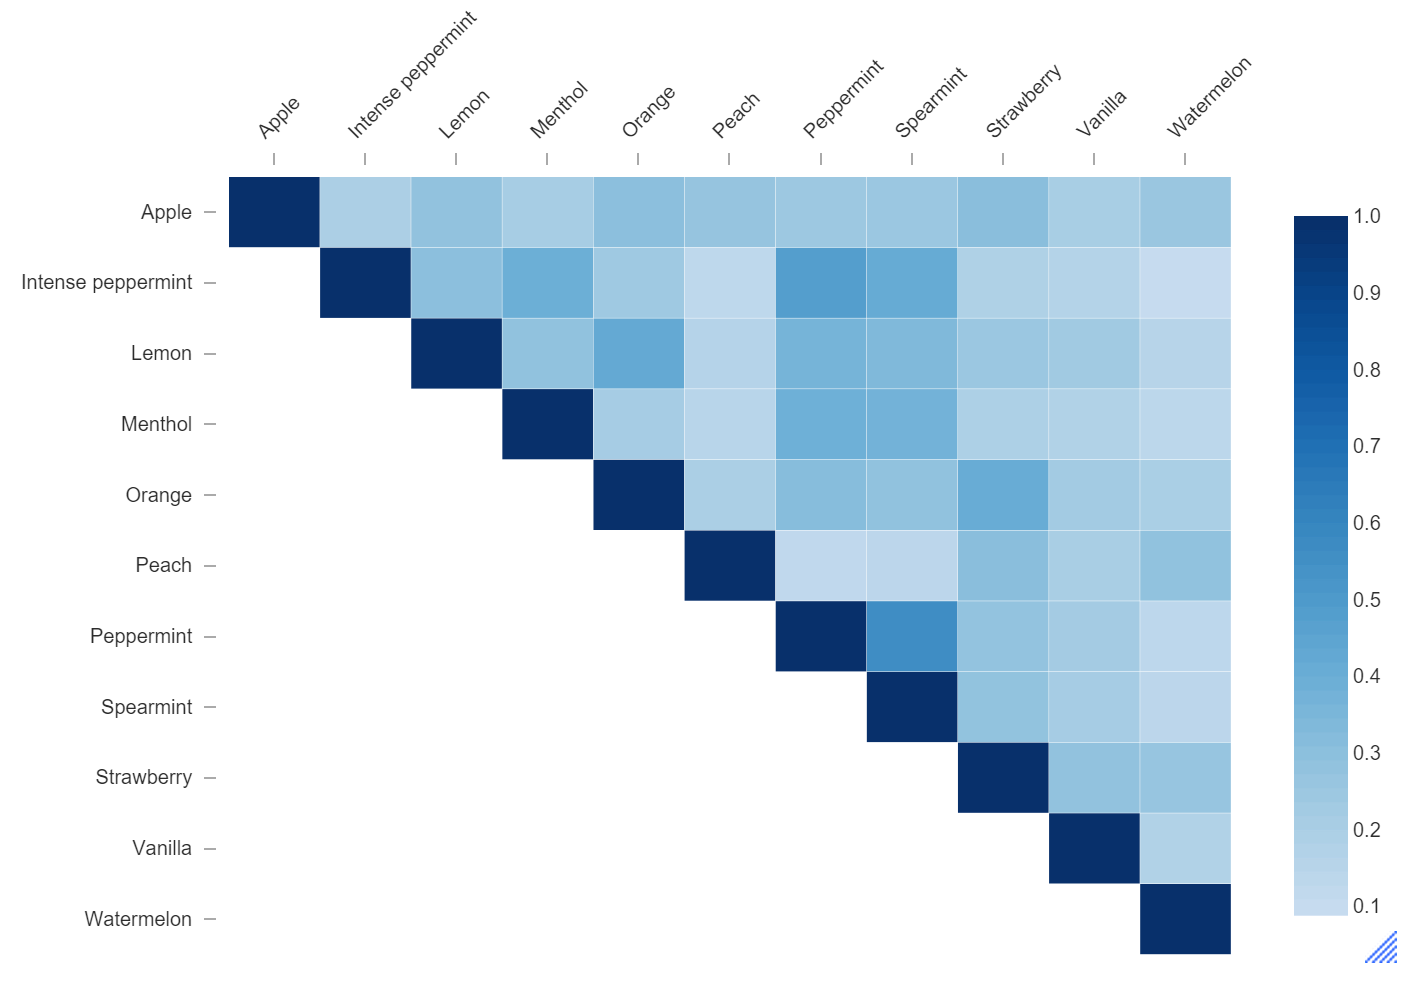
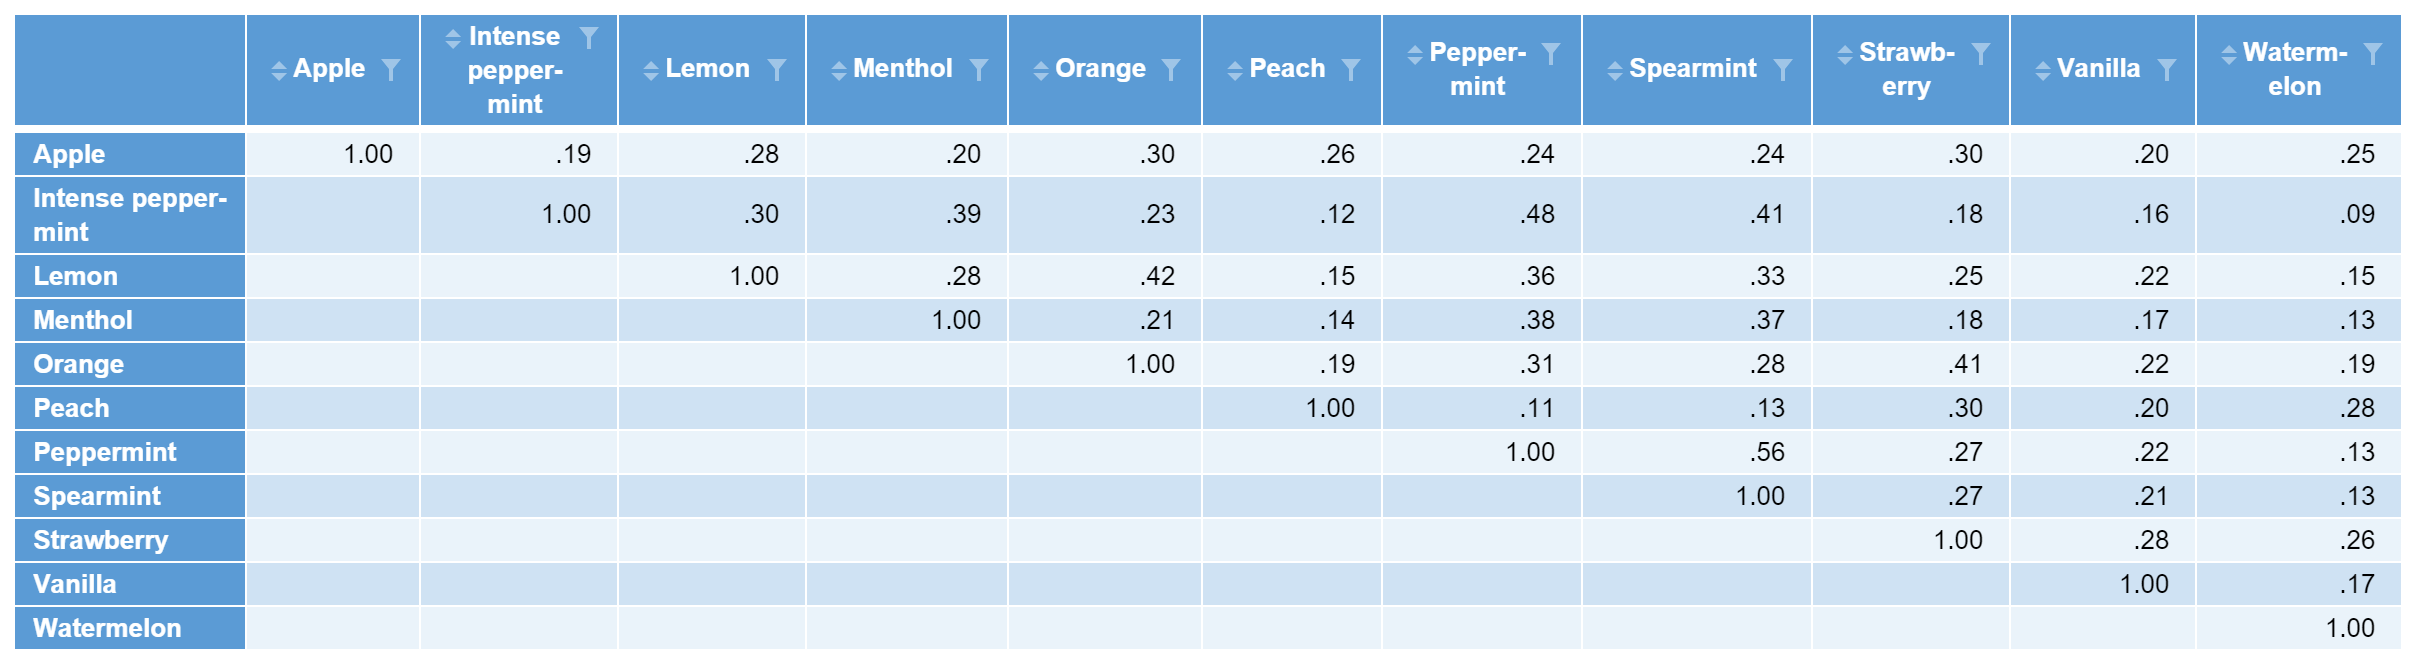
The result is a table that contains all of the Jaccard coefficients for each pair of variables.
 Visualize the results
 Visualize the results
A heatmap is an ideal way to visualize tables of coefficients like this. To create a heatmap for this data in Q,
- Select Create > Charts > Visualization > Heatmap.
- Under Inputs > DATA SOURCE, click into Output and select the output for the Jaccard coefficients that was created above.
- Tick Automatic.
I’ve shown an example of the resulting heatmap, below. With the blue default color palette, the largest Jaccard coefficients will be the darkest blue. Looking for dark patches off the diagonal allows you to identify the pairs of variables with the biggest overlap.