How to Calculate Sentiment Scores for Open-Ended Responses in Q

Sentiment analysis is a way to quantify the feeling or tone of written text. In a survey context, this is a useful technique for gauging the overall attitude towards a brand (or whatever you like). In sentiment analysis, each case receives a numeric sentiment score (on a negative to positive scale).
Nothing is ever as accurate as a researcher manually coding text variables, one case at a time. But in the case of a large survey sample (or in the case of Big Data), the efficiency gained in using sentiment analysis can outweigh the loss of accuracy that you get with coding.
How does it work?
Q compares the contents of each text response to English-language dictionaries of positive words and negative words. Positive words get a +1 scoring, negative words get a -1 scoring. The final sentiment score for each response is the sum of these scores. The process also tries to identify when a sentiment has been negated. For example, “not good” would generate a score of -1 instead of a score for 1.
To illustrate, consider these cases from a hypothetical text variable. The first cases receives a sentiment score of +2, and the second cases a score of -2. The words contributing +/-1 towards the total score in each case are in brackets:
I really enjoyed (+1) the webinar – it was fun! (+1): Score = +2
I didn’t like (-1) the webinar – because I hate (-1) the speaker: Score = -2
A sentiment score is generated for every respondent in the survey, and saved as a numeric variable. Q assigns a missing sentiment value for people without responses.
How do you run it in Q?
Q makes it convenient to compute a sentiment score variable. Simply put the raw text variable in a summary table (choosing the text question as the blue question) and then select Create > Text Analysis > Sentiment. Another way to achieve the same thing is to select the variable in the Variables and Questions tab (and then go to the Create menu).
The result is a new numeric variable in your project available for your analysis. You can use this variable in a variety of ways:
- In cross-tabulations with other questions to see how the sentiment score may vary for different groups within the sample (this is a good example of where Smart Tables in Q might come in handy!).
- Looking at correlations of sentiment scores with other numeric variables (eg: use Correlation Matrix).
- You could also turn the numeric sentiment score variable into a categorical variable (ie: a Pick One question) to divide your sample into those who are positive, neutral and negative on the topic.
In some cases, you may like to “clean” your raw text variable before you computing the sentiment scores. This is where the Text Analysis Setup feature can help (see here for instructions). This creates an R output in the Report (not a variable) where the raw text is processed for spell-checking, stemming, removal of words, replacement of specific words, and combination of words into phrases. To calculate the sentiment scores from the Text Analysis Setup, simply select it in the Report, and use the Create menu: Create > Text Analysis > Sentiment.
Examples
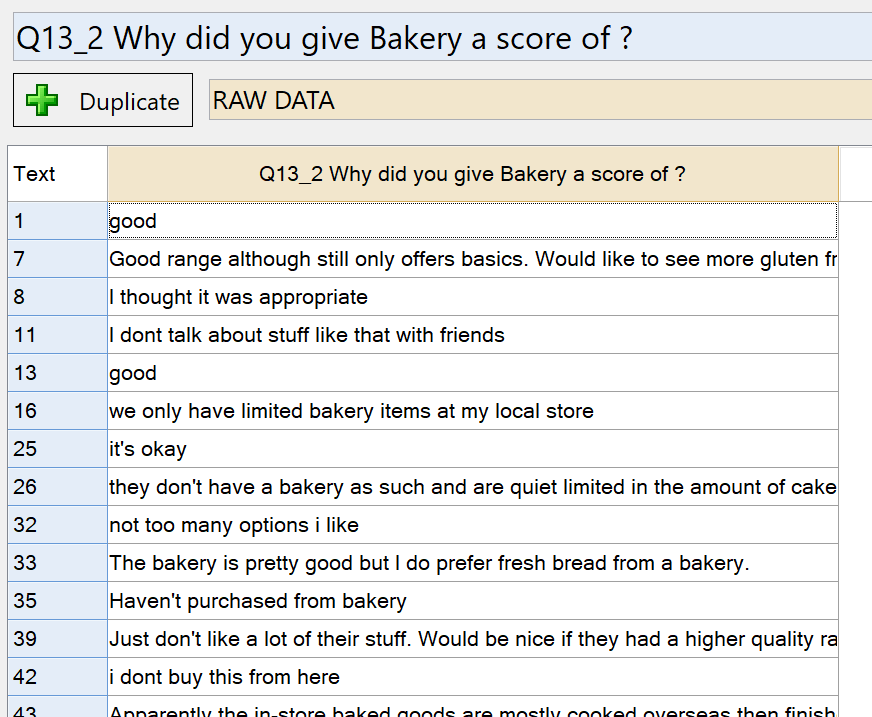
I have a survey that asked people about their experiences in the supermarket that they shopped at most recently. The survey data includes NPS scores for the different departments (dairy, bakery, cleaning products, etc), as well as open-ended questions about these departments. In this example I compute sentiment scores for the open-ended question for the bakery. The initial text looks like this:
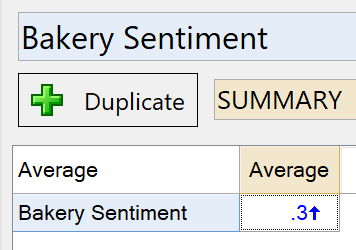
The average sentiment for people responding about bakery section is 0.3. This indicates that the overall level of sentiment is slightly positive.
To get an understanding of the distribution of sentiment in these responses, you can change the Question Type of the sentiment question from Number to Pick One. Each unique value becomes a category.
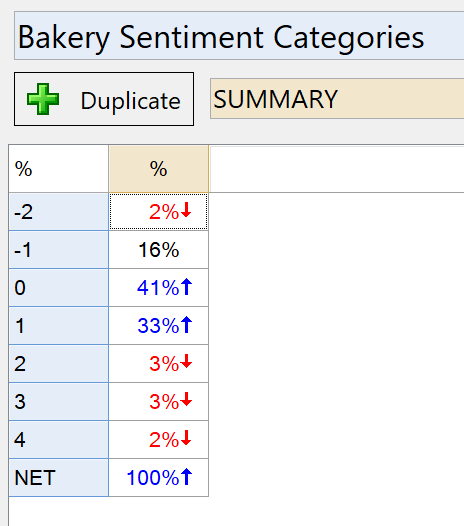
Here, we can see that the vast majority of responses have been given a score of 0 or 1. This indicates quite weak sentiment. For a question on a more divisive topic, you may be able to identify a much greater spread of scores.
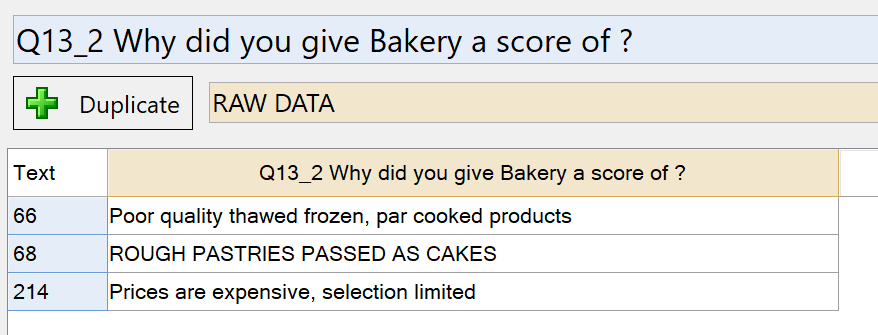
If you want to identify the most negative responses for the bakery, make a filter. I right-click on the 2% cell for the sentiment score of -1, and I select Create Filter. Then I go back to my original table and apply the filter in the Filter drop-down menu at the bottom of the Q window. The three most negative responses in this question are:
You can also use sentiment analysis with social media data. This was the subject of this case study which analyzed Trump’s Tweets (from the 2016 election). For a demonstration of how sentiment analysis works on raw social media data, check out the Trump Tweet Case Study and associated Text Analysis webinar.
To discover how to do more in Q, grab your free one-on-one demo with a market researcher!