

How to Combine Complicated Tables in Q Using R
Clients often like to have topline results from the key questions in their survey combined into a single table. This allows for an easy, at-a-glance summary of the latest results.
Q’s integration with the R language makes it possible to splice and dice tables and to combine results that you can’t otherwise show on the same table. Examples include combining results for brand funnels, and mixing results from numeric data with those for categorical data. When you show a single statistic on each table, you can use standard methods for combining tables in R. This is discussed in our other post, How to Build a Brand Funnel in Q Using R. If, on the other hand, your table contains multiple statistics, inluding the Column Comparisons statistical tests, a different approach is required. In this post I show you how to combine more complicated tables, and also give details on how Q tables work in R.
Simple tables
Consider the following crosstabs, which show brand awareness and brand attitude results split by the age groups in my sample.
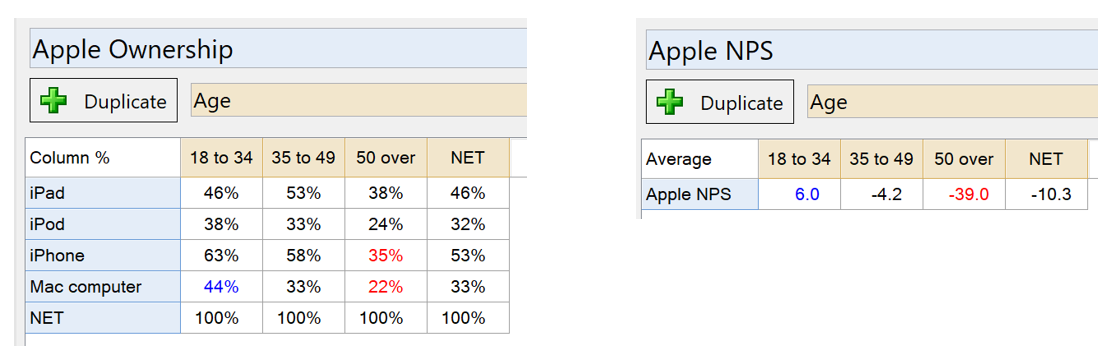
When I refer to these tables in an R Output, they exist as matrix objects. In R, a matrix is a collection of data values, arranged over two dimensions (rows and columns), and all the data values have to have the same type (in this case they are all numbers).
I can learn what type of object something is in R by using the class() function in an R Output. In this case, for example, I can write class(table.Brand.attitude.by.Age), and get the answer matrix.
For matrices, R has standard functions for combining them together:
- rbind(), to combine the tables by their rows, or stack them on top of one another.
- cbind(), to combine the tables by their columns, or place them next to one another.
For more on combining tables like these, see How to Build a Brand Funnel in Q Using R and How to Do Simple Table Manipulations in Q Using R.
Combining tables with multiple statistics
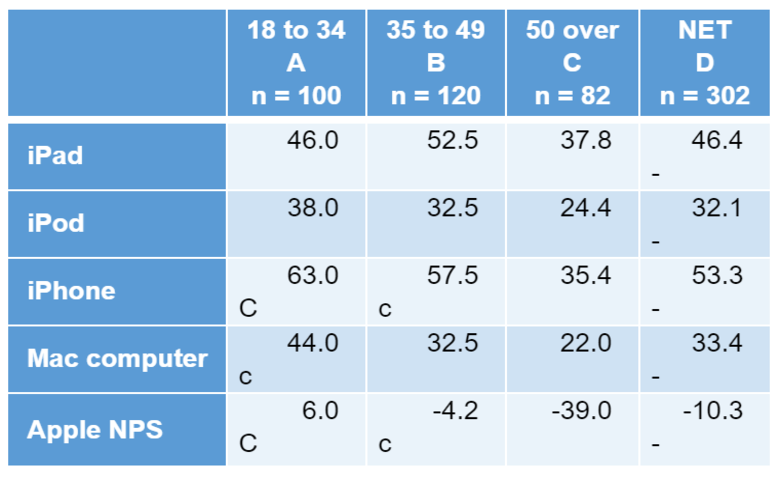
Tables like the following ones cannot be represented as matrices in R.
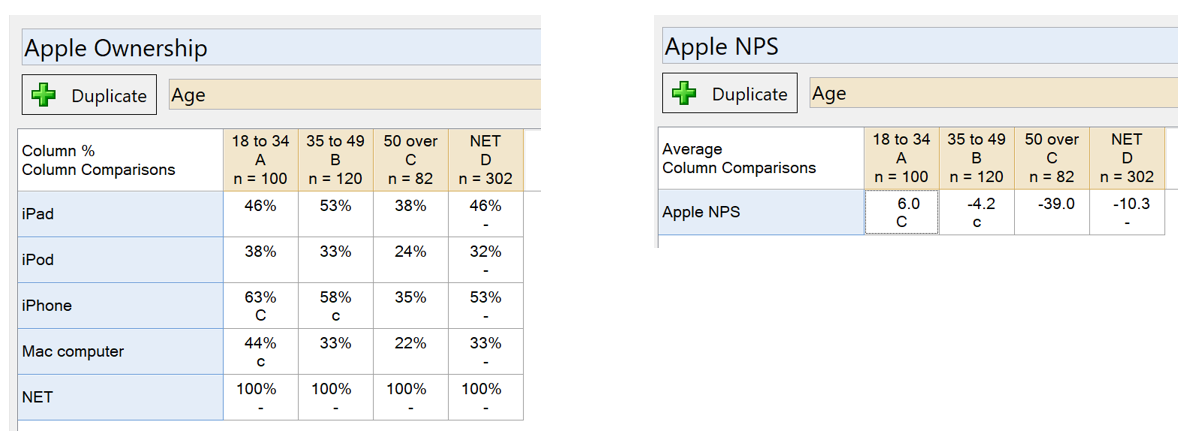
This is because each “row” of the table is actually two rows, one for the main statistic and one for the column comparisons, and because the values in the table are now two different kinds (a mixture of numbers and letters). Instead, each of these tables is an object known as an array. You can think of an array as two matrices stacked on top of one another, along a third dimension.
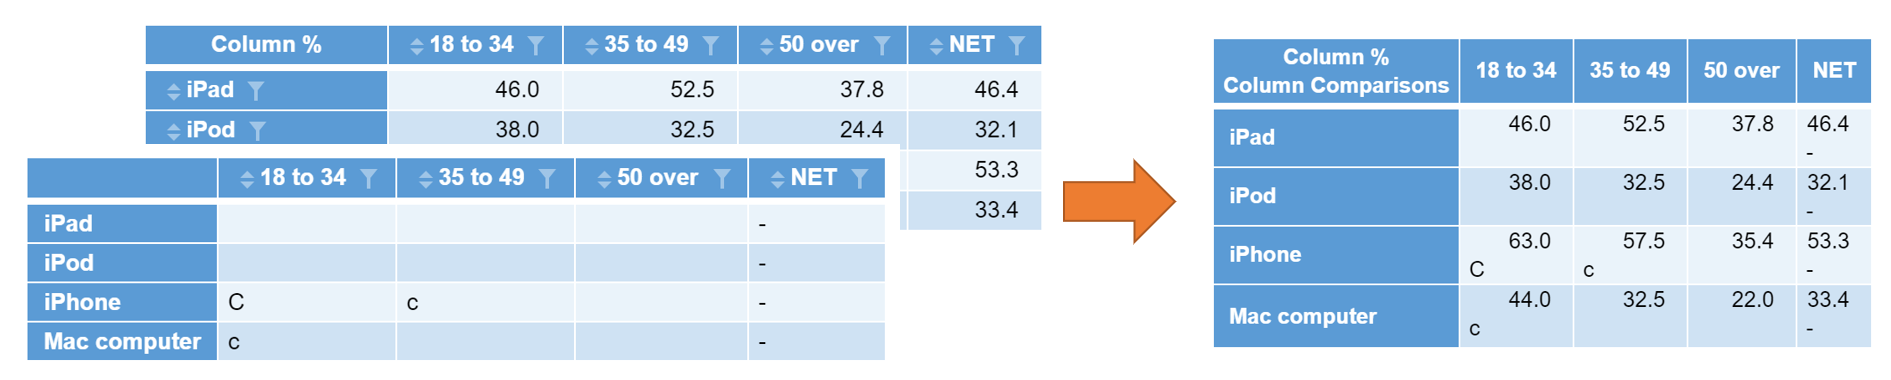
To combine two tables, like the NPS and Ownership tables above, you can use the following method.
- Select Create > R Output.
- Paste the two lines below into the R CODE section.
- Change the names of the tables you are referring to in the second line. To find the name of a table, right-click it in the Report and select Reference Name.
- Tick the Automatic box. This ensures that whenever the input data changes, the new table will update accordingly.
The code required is:
library(abind)
new.table = abind(table.Apple.Ownership.by.Age, table.Apple.NPS.by.Age, along = 1)
dimnames(new.table)[[3]] = c("","")
new.table
The resulting table will contain the NPS scores, and their statistical testing letters, appended below the ownership results.

There are several key points to notice about the code above:
- I use the abind() function from the abind library.
- I listed the reference names of the tables I wanted to combine.
- I used the along argument to specify which dimension of the array to join the tables along. The dimension ‘1’ stands for the rows. If I wanted to combine columns, I would instead supply dimension ‘2’.
- I set dimnames(new.table)[[3]] to remove the names of the statistics. These would normally be shown in the top left corner. You could set non-blank entries here if you want to add additional information in the top left.
So remember, when you need to combine many tables which show multiple statistics, use abind! Discover how to do more in Q.


