One of the standout features of Q is its ability to automatically group variables into questions and identify the question type. This works best when you have standard labels and an SPSS (.sav) file, which includes the metadata for each question. However, sometimes you don’t have the best labels (or even a .sav file for that matter) and need to manually group bits of your data.
Before we get started, it’s important to be familiar with the different Question Types used in Q. There is a great explanation along with a training video and modules on our wiki.
The two key things to keep in mind with grouping together variables into questions are:
- Order – the order in which options appear for each attribute. You can drag and drop rows on the Variables and Questions tab line them up correctly.
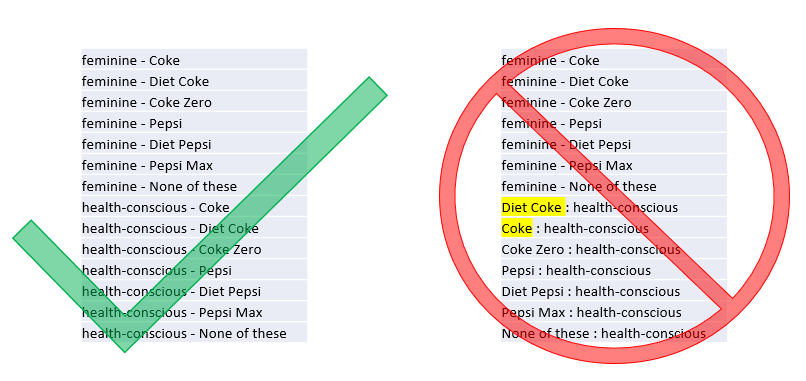
- Labels – the labels of the questions must include both the final row and column names (Note: these are also case-sensitive). I’ve found it yields the best results to separate them using spaces and a special character like “–”or “:”. Q makes it easy to edit labels by changing them directly on the Variables and Questions tab, using Search/Replace (yep, with wildcards!) or by copying/pasting using Excel.
Load the data
For my example, I will use the following CSV file.
To load the data into Q:
- Download the file to your computer.
- In Q, go to File > Data Sets > Add to Project > From File, select the file, and click Open.
- Click OK again to have Q automatically try to group together your questions.
- Since we read in a CSV file, there are a lot of hidden copies of our original text variables on the Variables and Questions tab. To tidy this up and send those to the bottom, go to Automate > Browse Online Library > Move Data > Move All Hidden Questions to the Bottom.
Review the data
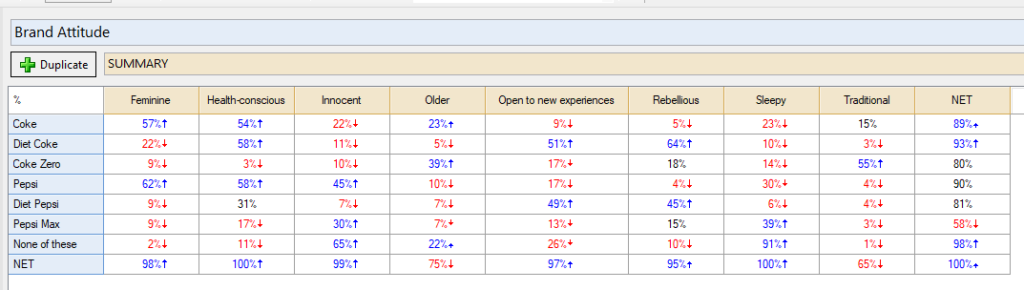
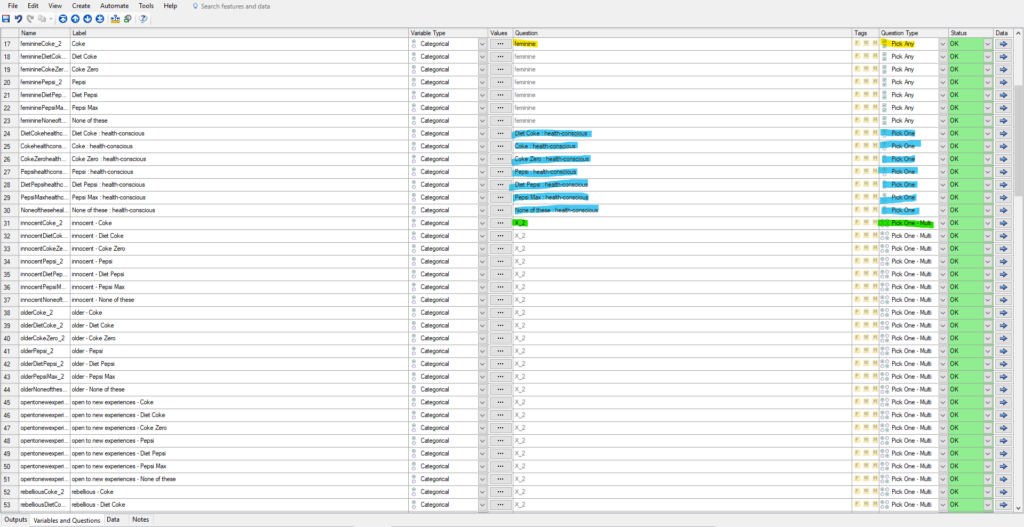
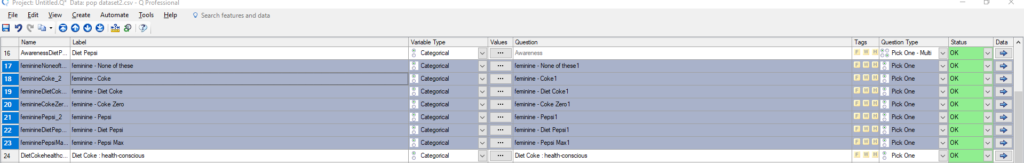
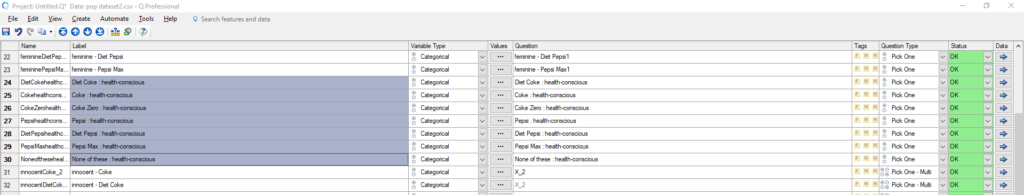
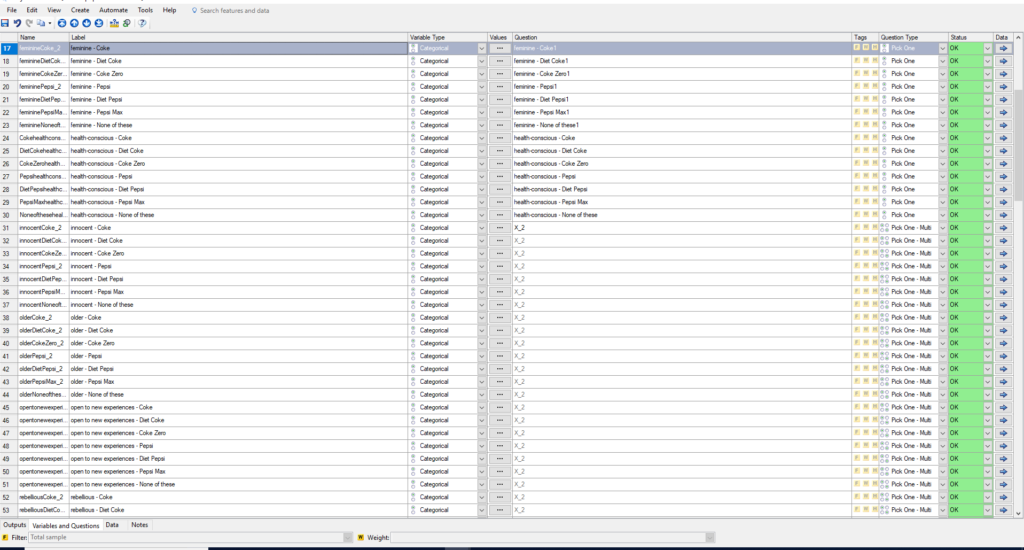
Let’s go to the Variables and Questions tab and inspect our Brand Attitude data (shown below). You can see the brand attitude question looking at attitudes and colas is broken into several questions.
A few things to note:
- Feminine is its own Pick Any question (in yellow)
- Health-conscious is broken into multiple Pick One questions, where the colas are out of order and labels are swapped (in blue)
- The rest of the attitudes are grouped into one Pick One – Multi question (in green)
Standardize the labels and order
Let’s clean up the data so we can group it together into a Pick Any – Grid.
- Highlight all rows of the feminine question, then right-click and select Revert to Source. This will break apart the question and show you the original labels.
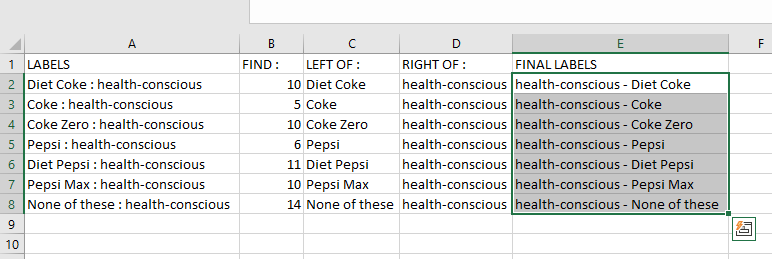
- Manually change the labels for the health-conscious rows to look like the feminine You can also highlight the labels, copy (Ctrl + C), and paste (Ctrl + V) into Excel to modify using a formula. You can then paste back into Q.To copy:
 In excel:
 Back into Q:
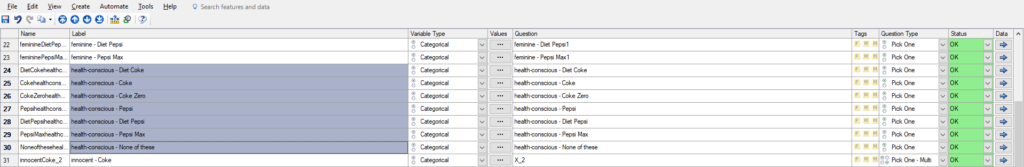
- Drag and drop the rows on the Variables and Questions tab to make sure the options are in the same order for each set of attitudes. Reorder feminine so that None of these is at the bottom of the list of feminine options, and reorder health-conscious so that Coke comes first.
Now all your labels should look similar:
Combine the questions
Now that our labels are ordered and standardized, let’s combine them into a Pick Any – Grid question.
- On the Variables and Questions tab, highlight all rows of the brand attitude data.
- Right-click and select Set Question.
- Give the new question a Name like “Brand Attitude” and set the Question Type to Pick Any – Grid. Click OK.
- You will see a box alerting you that Q has automatically detected how to split the variable labels into row and column labels. Click OK.
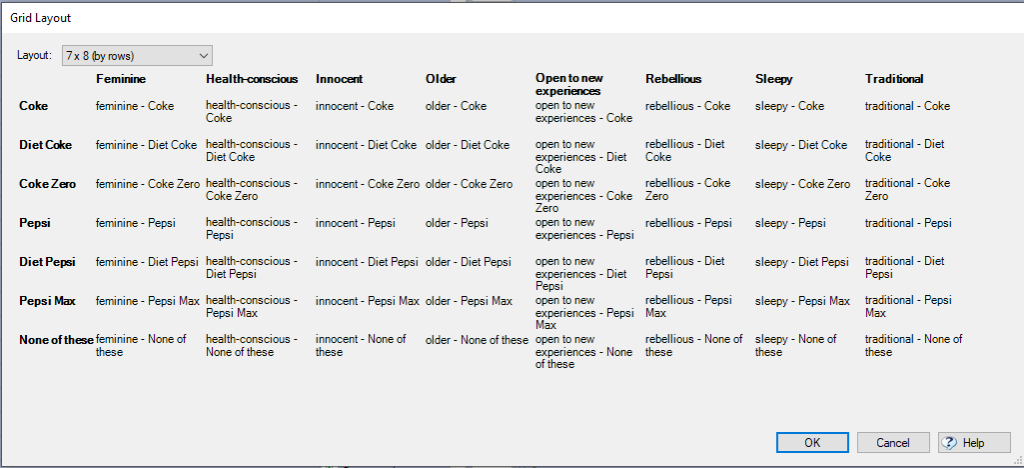
- The Grid Layout screen that pops up gives you a preview of the row and column names, and which label corresponds to which cross-section. You may need to play with the Layout dropdown to get your grid to appear closer to what you need. Click OK.
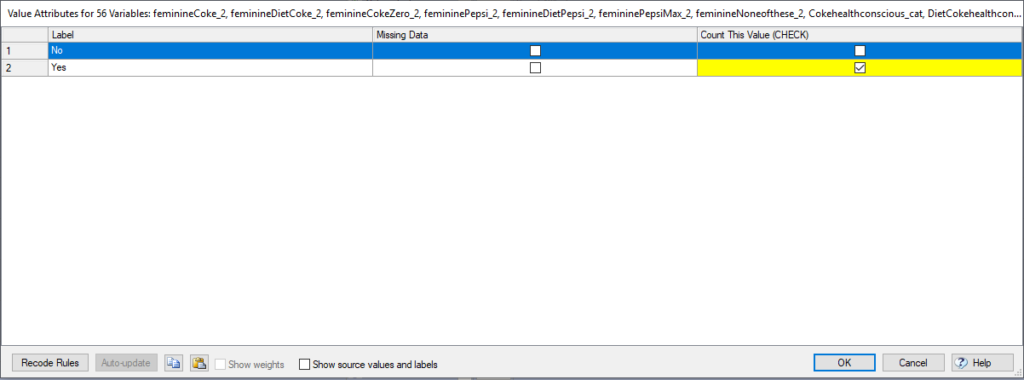
- In the values window that pops up, make sure you check Missing Data for any values that suggest that the respondent hasn’t seen or answered the question. Check Count This Value (CHECK) for any response that you want to count as an affirmative response in your grid. In this example, “Yes” will be checked to Count and “No” will have no checks. Click OK.
Now you have created your own Pick Any –Grid!