

How to compare previous periods using an unequal categorical variable
In a previous post, I outlined how you can use Date questions to compare columns in a table against the previous period (using Q’s arrows/fonts significance indicators) – a very handy feature for tracking studies. The post outlined how you can transform a categorical variable into an official Date question by creating a JavaScript variable. Sometimes researchers don’t have a time-date variable, but rather, just an indication of the period in a categorical variable. This categorical variable is often called a wave.
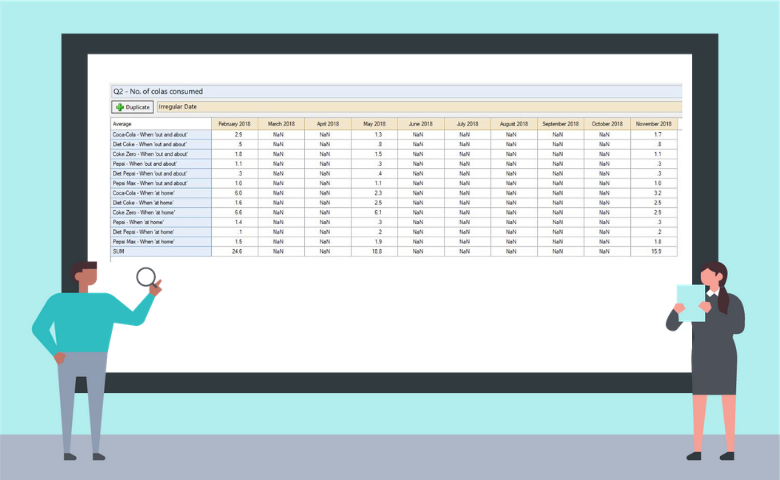
That’s all very well and good, but the technique doesn’t work when you have irregular periods. See the picture below:
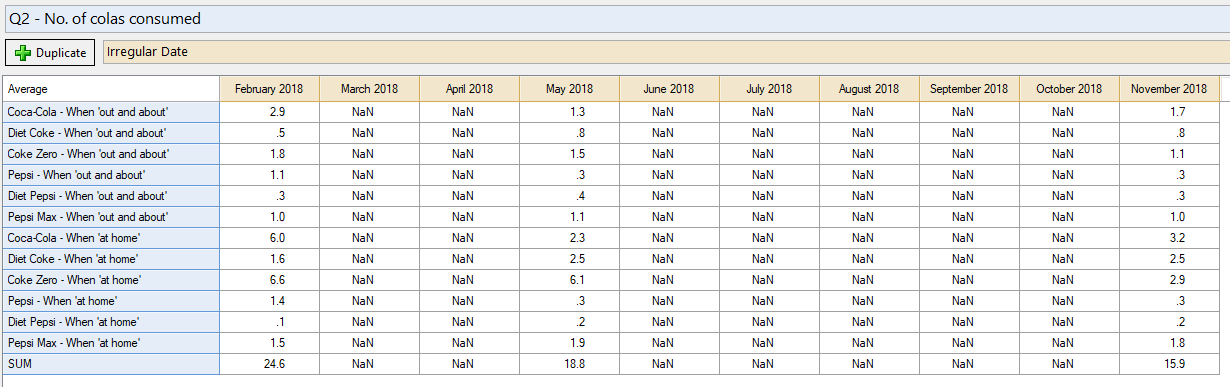
Date questions aggregate time into regular periods, meaning the categories of a Date question can display unwanted empty periods. For example, in ad testing and tracking, it’s not uncommon to have ‘dips’ at irregular intervals (eg: pre-campaign and post-campaign). As per the case above, if you had a dip in Feb 2018, May 2018 and then Nov 2018, then a Date question would show all the months in-between for the year.
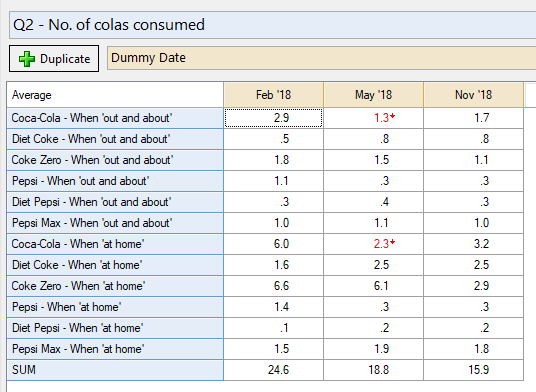
When, actually, you only want to compare Nov against May, and May against Feb. With the same example data, the average statistic of 1.3 is significantly less than Feb ’18 for the first row.
The solution is to create a dummy date variable, and then to relabel the time intervals (using a rule). In this post, I explain how you can do this via a worked example.
Create your dummy date variable
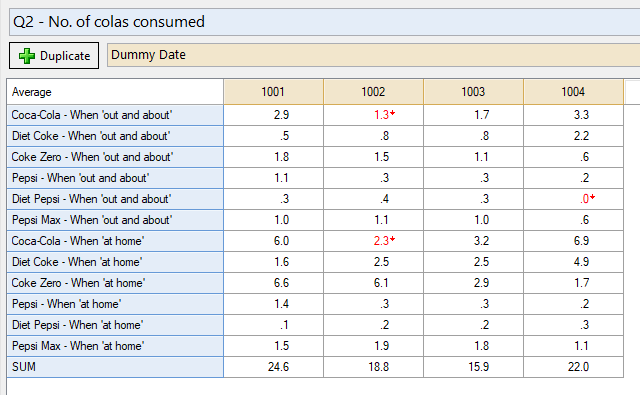
Creating a dummy date question is essentially the same as creating a date question, except you give the variable dates that are bogus and regular. I typically set each period at 1001 with each successive wave as a year (so 1001, 1002, 1003, etc). Using a ridiculous date such as 1001 AD means there will never be any doubt that it’s a dummy date variable!
So the JavaScript for it is basically:
if (dip == 1) Q.EncodeDate(1001,01,01);
else if (dip == 2) Q.EncodeDate(1002,01,01);
else if (dip == 3) Q.EncodeDate(1003,01,01);
else if (dip == 4) Q.EncodeDate(1004,01,01);
else NaN;
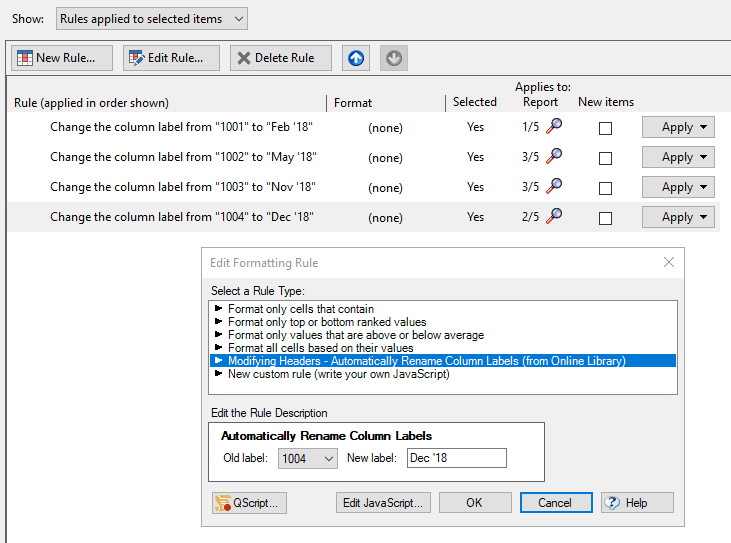
Apply a rule to change the labels:
In the Automate menu, we have a rule that can manually relabel column labels. It can be found under Automate > Browse Online Library > Modifying Headers > Automatically Rename Column Labels.
So basically, you rename ‘1001’ to be whatever you want (eg: the first dip). Likewise for ‘1002’, etc. So in the above example, I applied the rule (multiple times) to make the following:
Set the statistical assumptions
Finally, don’t forget to change the Statistical Assumptions (under Table Options or Project Options) to compare to the previous period for Date questions. (The previous post notes how to do this). The footer on the bottom right should display this setting.
![]()
Try for yourself
The worked example in this post can be found in the attached QPack.


