

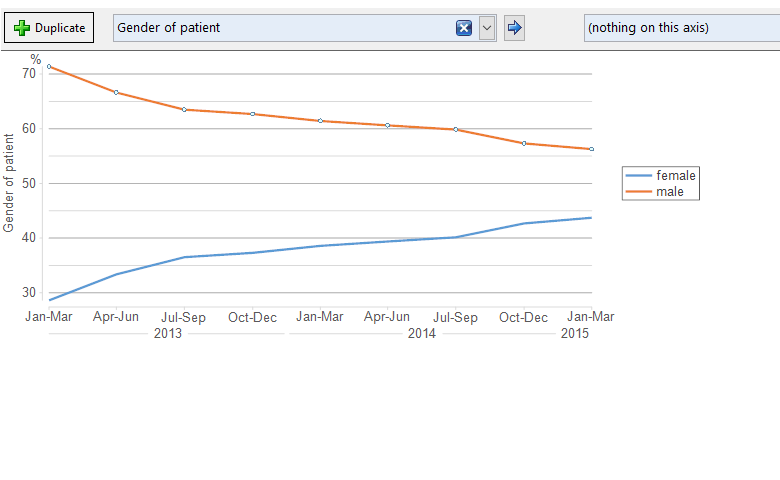
We have previously written about how to use moving averages to display trends in a chart. However, there are occasions when the smoothed values themselves are of interest. You can compute moving averages using a wide variety of tools in Q.
Setting up the date variable
Before beginning any analysis, it is important to ensure that the date variable is set up properly. In the Variables and Questions tab, confirm that the Question Type is set to Date/Time (if it is not, you may need to convert the variable).
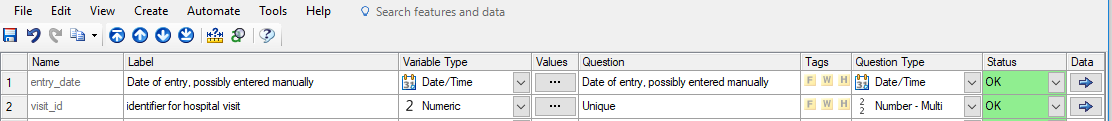
You should also click the ellipsis in the Values column to check the aggregation unit of the date variable. For example, if you want to compute five-month moving averages, then the aggregation unit should be in months.
Construct a Pick Any Question for the moving average
If you want more control over the window used to construct the moving average, consider constructing a Pick Any Question. This will allow you to specify the exact start/end dates of the windows. You can use the Pick Any Question feature for multiple crosstabs with different variables. In the Variables and Question tab, right-click on the date variable and select Insert Ready-Made Formula(s) > Date > Moving Average.
Simple lagged rolling average
One method to create a rolling average is to create a crosstab and then select Automate > Browse Online Library > Modifying the Whole Table or Plot > Creating Rolling Averages. Note that you can click on the Rules tab at the bottom of the window to modify the settings. It is also possible to duplicate the table and remove the rolling average from one of the tables. In contrast, the method below applies the smoothing to all instances where the variable is used.

Moving averages in Time Series Analysis
A second method to compute rolling averages provides more options to control how averaged (smoothed) values are computed. Create a crosstab with the date variable or moving average Pick Any Question in the brown drop-down menu of the crosstab. Right-click on the row labels (not the date categories) and select Time Series Analysis. Typically, you would select all the row labels, but it also possible to use different smoothing options for each row.
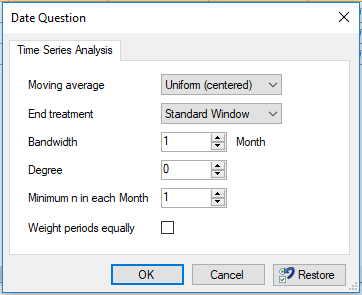
The dialog box contains options for lagging, uniform and tri-cubic moving averages. Using uniform instead of lagging moving averages uses centered windows. It also adjusts the windows so values at the ends of the series do not get converted to NaNs. If tri-cubic weights are used instead of uniform, then data points closer to the target value will have larger influence on the estimated values.
Another important parameter is the degree. When the degree is zero, then the smoothed value is simply the mean of values at nearby points. But when the degree is higher, then a local polynomial regression is used to fit a line (degree = 1) or curve (degree > 1) to nearby values.
Need more help with Q? Check out the other posts on our blog!


