In constructing crosstabs, it can be helpful to see more than one question on an individual axis. Other instances may require labels to be “nested”, with one layered beneath another, in order to see how data splits across different response options. This is carried out in Q through the creation of banners. In this blog post, we will explain the significant difference between banners in Q compared to other programs, walk you through the two different means for building banners in Q, and illustrate options for editing existing banners.
What is a banner?
In Q, a banner is a means for combining multiple questions together as to see their outputs simultaneously. However, in most other programs, banners are a function specific to a table, meaning that you are deciding to add multiple questions into the rows or column of an individual table. In Q, the creation of a banner is similar to the creation of a new question. This allows for the banner to be located in either the rows or columns, used across multiple tables or charts, and simultaneously updated across the entire project when altered in one location.
In the example below, I’ve built a banner including a country variables to illustrate the differing average prices of wine:

There are 2 methods for creating banners in Q: Drag and Drop or Code.
Building a banner using drag and drop
Q’s Drag and Drop method for creating banners is the quickest and most straightforward process. This is because the interactive interface allows you to manage many banner features by either dragging or dropping the questions of interest or making layout selections. To access the interface either select Create > Banner > Drag and Drop from the menu bar or right-click on a question header on an existing table and select Create Banner.
You will then be presented with the following window:
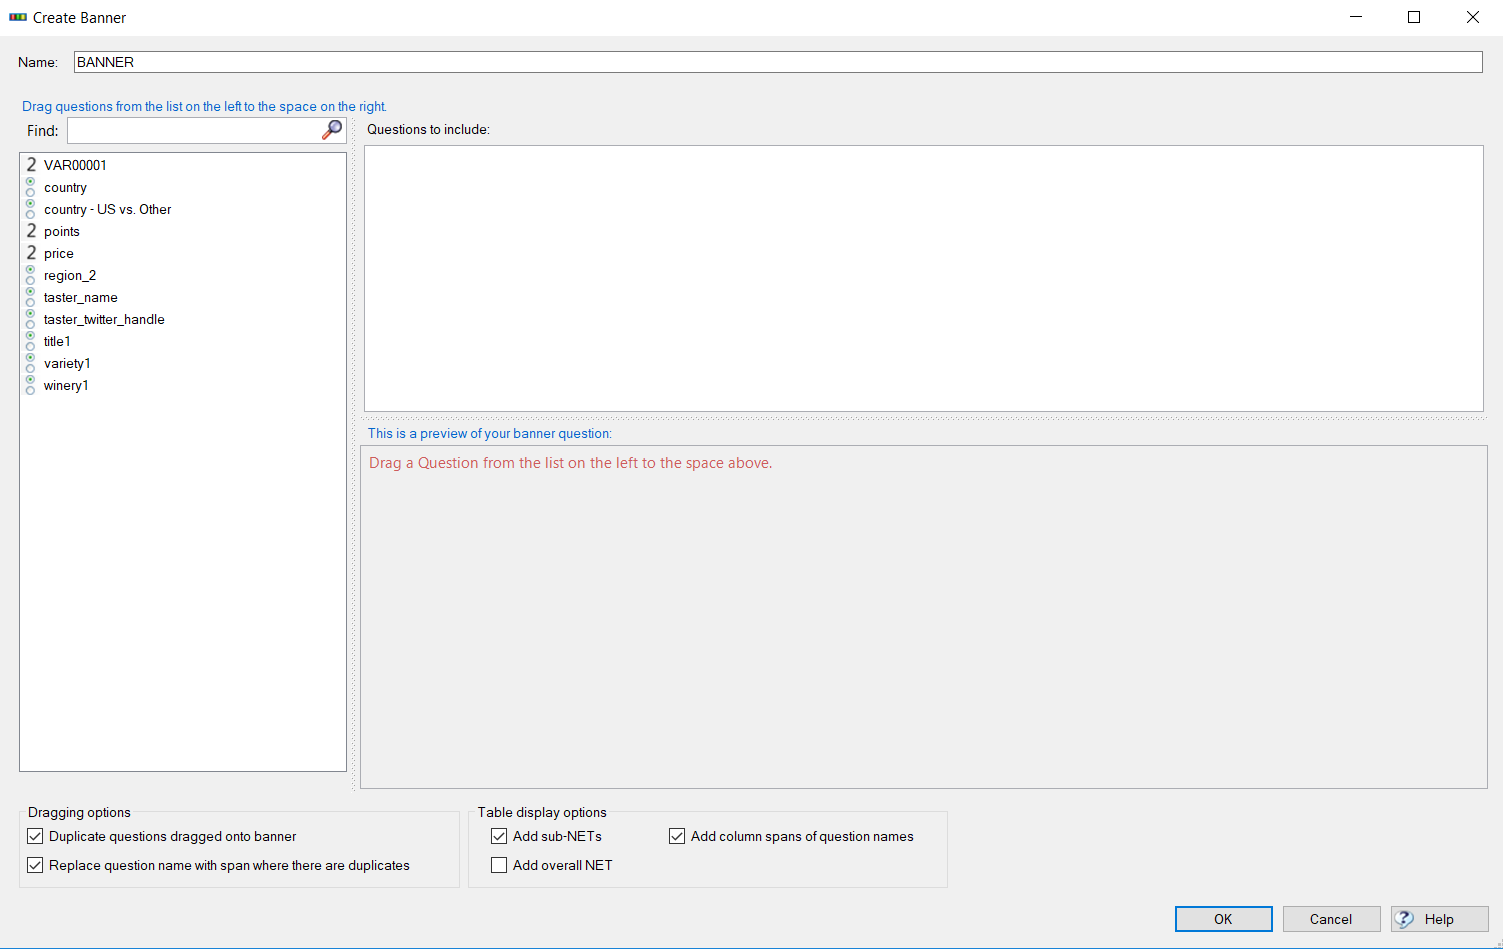
The left side of the window will be populated with all of the available questions in your study, the white space will house every question to be included in your banner, and the area below will display a preview of your proposed banner (if you right clicked on a table question, the white space will be preloaded with the question you right clicked on).
In the image below, I’ve populated the white space with the “Country – US vs. Other” and “North America vs. Other” questions to generate the banner shown in the example above.

You can rearrange the questions by dragging and dropping them to either the right or left, or you can nest labels by dragging one on top of the other. In the below example, I have nested the “Gender” question below the “North America vs. Other” question.

Also, note the array of selections available at the bottom of the window. The selections on the right toggle sub-NETs (for each individual question), an overall NET category, and column spans (question name labels the stack on top of the collection of response options). The selections on the left are for dictating whether questions are duplicated when dragged onto a banner or if question names are replaced with a span when there are duplicates.
If you do not tick “Duplicate questions dragged onto banner”, Q will not create a new question when a question or variable is dragged into the “Questions to include” section. Any changes made in the banner will also be applied to other uses of the question in the project. If you select “Replace question name with span where there are duplicates”, Q will automatically hide the name of the question and instead create a new span using the original question name.
When you click OK, Q will automatically load the banner you’ve created into the column section of the table you currently have selected.
Building a banner using code
If you need to create a banner with more complicated logic, you can use the Code option. To access this interface, select Create > Banner > Code from the menu bar. You will then be presented with the following window:
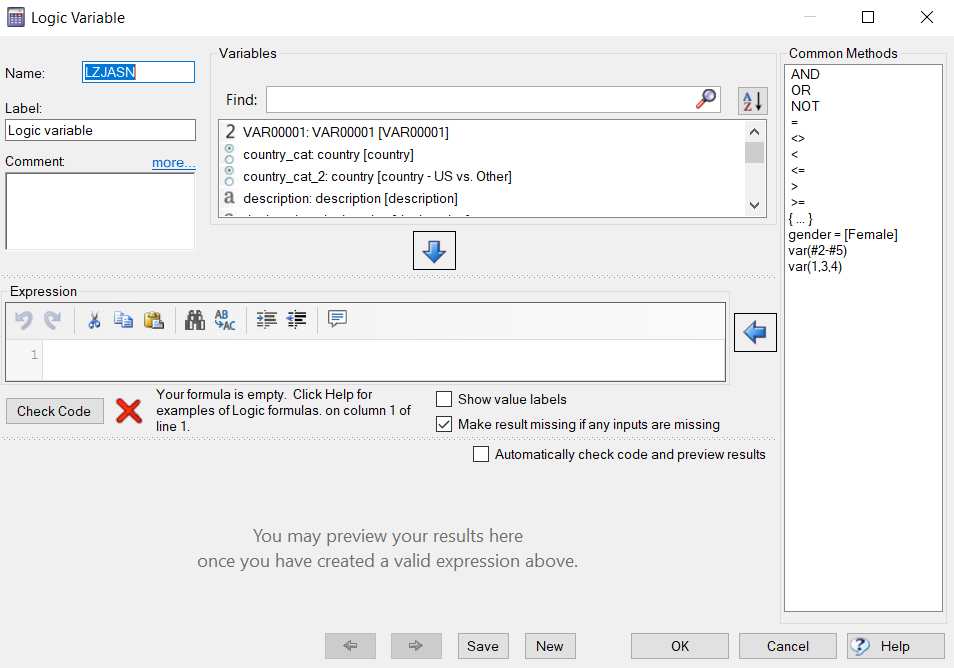
You will now follow the steps for creating a series of Logic Variables to populate your Banner. After completing the settings for a single Logic Variable, click the New button at the bottom of the window to move onto creating the next Logic Variable (detailed instructions for creating Logic Variables are located our Wiki.). Important fields to note here are the “Label” field where you can specify how the variable will be labeled and the “Common Methods” listed on the right for easy logic creation.
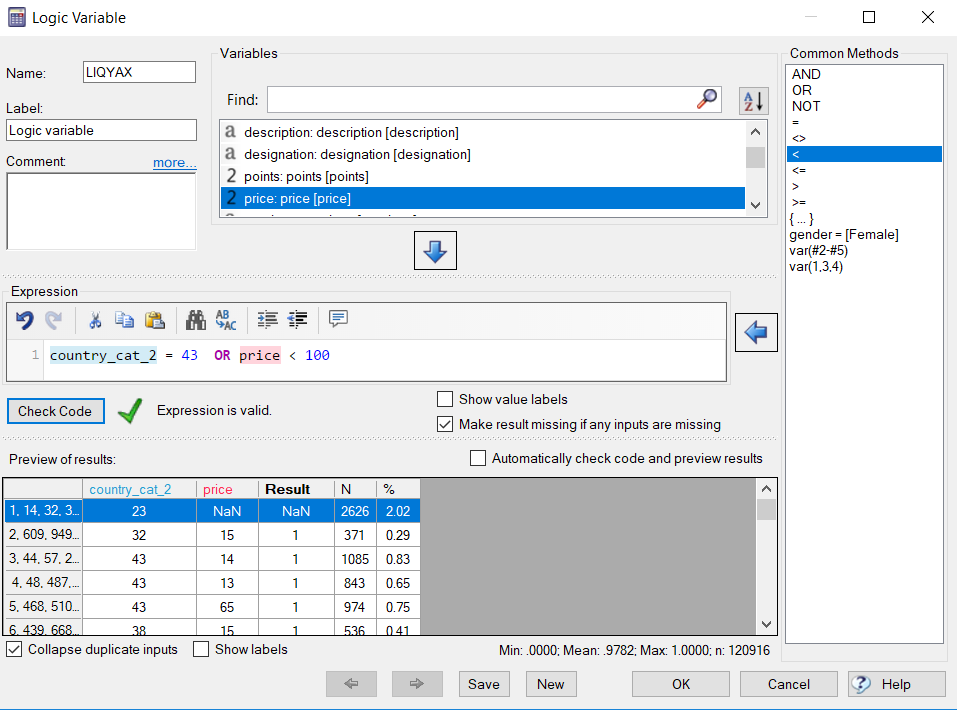
In the example below, I’ve created Logic Variable below to signify if a respondent either is from the US (country_cat_2 = 43) or the price of wine was less than $100.
There are some tools that you can use to help you construct your formula and to check that it is correct.
Right-clicking variables
If you right-click on one of the variables in the Find section, you have two handy options available:
- Values. This lets you see the values and categories that are available for this particular variable. This will help you work what values to refer to in your expression.
- Insert reference. This will bring up a list of already built references that you can use as a starting point to building your formula.
Check the preview
For added assistance in ensuring that your logic has been set up correctly, refer to the Preview of results section located at the bottom of the window. This will show you a list of all of the values for all of the variables that you have used in your formula. For example, in the screenshot above, it shows all the values for country_cat_2 (the countries in my study) and price. Then, the Result column shows the value that the variable will take.
A value of 1 means the person in this new banner category, a value of 0 means they are not, and a value of NaN (missing data) means that the person is not included in the sample for this variable. You can show labels instead of numeric values by ticking the Show labels box.
By looking through this section, you can see how people are being assigned by your formula, and work out if your formula is doing the right job.
Once you’ve created all of the Logic Variables, click the OK button to view your Banner.
Editing existing banners
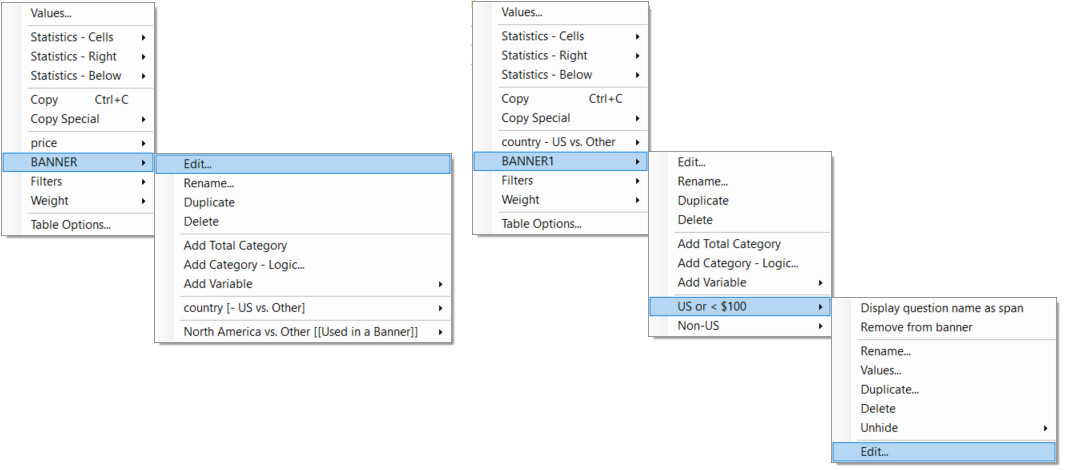
When you right-click on a table containing your banner, the context menu will contain a sub-menu for your banner. For example, if you check out my screenshots below, you’ll see my banner, BANNER, appearing in the menu. In you go into this part of the menu you can edit the layout of the banner and you can edit individual logic variables if you have used these when building your banner.
Once any banner is created, either through drag and drop or through code, the structure of the banner can then be altered by right clicking on the banner on your table and selecting [Banner Name] > Edit.
If you want to adjust the logic that you used in creating the banner points, you should select [Banner Name] > [Question Label] > Edit.