How To | R | Using Q | Using R/JavaScript
How to create a table of ranks from a crosstab
by Kris Tonthat

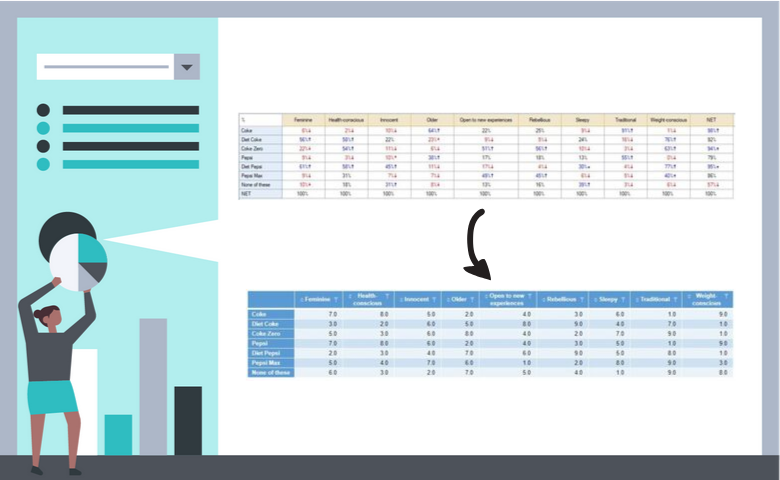
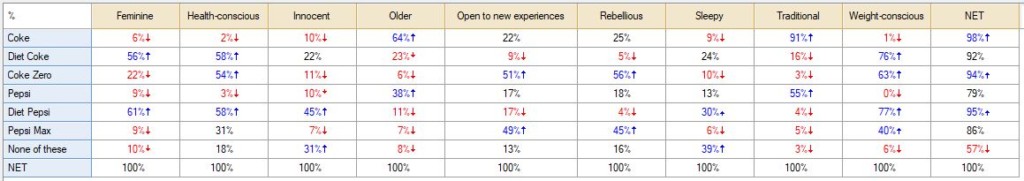
Creating a table of ranks from a crosstab is a simple process in Q. All it requires is a little snippet of R code. For this worked example, we are using data from a tracking study on cola brand perceptions. The crosstab we are working on compares a list of brand perception attributes for six types of cola. We are going to use some R code to rank the attributes for each cola.
You can replicate this example by downloading the QPack and running through each step in Q.
To convert the crosstab to a table of ranks:
- Right-click on your Report tree and select Add R Output.
- Paste the following code in the Properties > R CODE box and change the second line to the table you’d like to convert to rankings.If you are applying these steps to your own data step, assign x to the reference name of the crosstab you want to convert. This can be done by right-clicking the table in the Report tree and selecting Reference name…
If you’d like to create the ranks within each column instead of each row, change line 8 to the following: ranks = apply(x,2, rank,”average”) - Check Automatic to allow the R table to automatically update with your data.
The end result is an R output table with the brand attributes ranked for each type of cola.