

Filtering is the process of selecting part of your sample, and then creating a table, calculation, or other analysis using only that sample. It is sometimes called ‘subsetting’ or ‘drilling-down’. In the context of survey data, filtering amounts to choosing which respondents from the survey will be included in a crosstab or other analysis. In Q, a filter can be applied to any analysis to restrict the analysis to a group of interest. In this article we review the range of options available for creating filters in Q, and how to apply filters to a table or other analysis.
Applying filters to tables and outputs
You can filter most items in the Outputs tab using the Filter menu at the bottom of the screen. When you select a filter variable, it will appear in green and an additional drop-down menu will appear so that you can select another filter. The table footer will tell you about the sample that has been included, and the outputs of other analyses (like linear regression) will also include information about the filtered sample in the main body of the output.
When you select multiple filters for a table or analysis, Q combines the filters in an AND relationship. This means that only respondents who are in all the filter groups are included in the sample. When you apply more filters to the output you are narrowing the sample. In this example, only respondents who are Male AND aged 18 to 24 are included in the sample for this table.

Applying filters to raw data
The same menus are available in the Data tab. When you select a filter, Q will show the rows which match that filter in green. This is useful for checking data (you get to highlight respondents), and for deleting cases from your project.

To delete cases, apply the filter and then right-click and choose Delete Cases Matching Filter. Those cases will not longer be included in the sample for any analysis. You can return them again later by right-clicking and selecting Revert Deleted Cases.
Turn an existing variable into a filter
If there are binary variables in your data set that you want to use for filtering you can make them available as filters. Select the yellow F in the Tags column of the Variables and Questions tab.
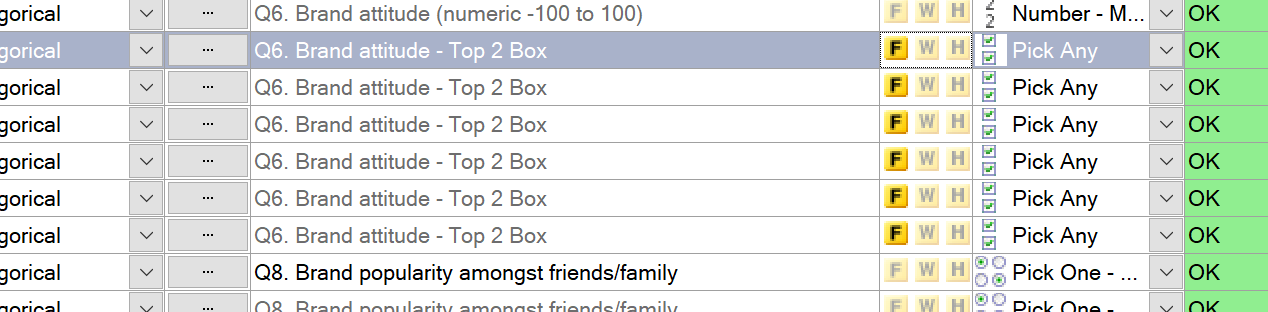
Any respondent with a value which is greater than 0 will be included in the filter. This means that it is most often appropriate to use variables which are binary. Variables which belong to Pick Any questions are automatically binary. In the example above, anybody in the Top 2 Box for the variables of the Brand attitude question will be included when filtering.
Simple filters
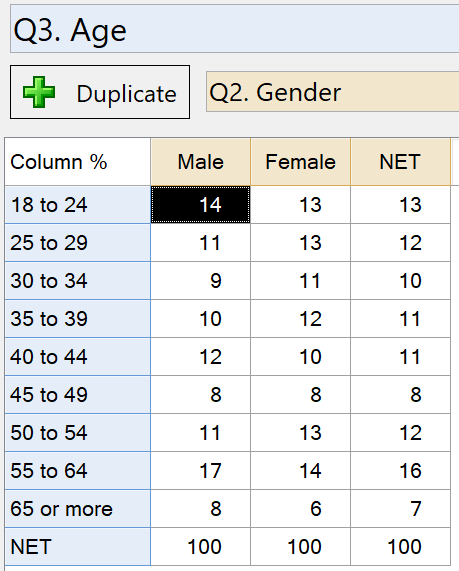
You can create simple filters directly from a table or crosstab by right-clicking on the cell for the group you want to use and selecting Create Filter. For example, right-clicking the cell below would create a filter for respondents who are Male and Aged 18 to 24.
Complicated filters
Where more complicated logic is required to specify a group of respondents, you can use Create > Variables and Questions > Variable(s) > Binary – Complicated Filter. This provides you with a point-and-click interface for constructing your filter. With this tool you can:
- Include conditions based on any number of variables.
- Select respondents based on numeric ranges and date values.
- Select respondents who only chose a particular option in a multiple response question or select respondents who did not choose a particular option.
More details on using this tool may be found here.
Formula variables
Even more flexible options for constructing filters are available if you write a formula to describe the respondents that are of interest. The following options are available from Create > Variables and Questions > Variable(s):
In each case, you want to design a formula which returns a 0 or 1 – with 0 indicating the respondent should not be included in the filtered sample, and a 1 indicating that the respondent should be included. Once the variable has been created, it must be tagged as a filter, as above. In general, the Excel-style and logic variables tend to be easier to construct, but less flexible. While, the JavaScript and R variables tend to be more difficult to construct, but more powerful.
Creating filters automatically
Use Automate > Browse Online Library > Filtering > Create Filters from Selected Data to generate filters based on all the categories in one or more of your questions. The filters will respect any merging you have done on your tables.
Awesome job, you’ve got filtering data down pat. Now learn how to do more in Q!


