

How to Read Stata DTA Files into Q

Survey data is often provided in binary file formats which contain metadata about how the data is structured. The most common of these formats is the SPSS SAV file, which is fully supported in Q. Another format which is often encountered is the Stata DTA format. Q does not have built-in support for this file format, but we can import it using external R packages. In this article, we go step-by-step through the process of setting up the DTA file as a dataset in Q.
1. Reading in the DTA file as an R dataset
To read the DTA file in as an R dataset, we open Q and select from the menu File > Data Sets > Add to project > From R. This will open a textbox where we can paste the following R code.
library(haven)
df <- read_dta("http://www.britishelectionstudy.com/wp-content/uploads/2018/01/bes_f2f_2017_v1.2.dta", encoding = "ISO-8859-1")
for (i in 1:length(df))
{
    if (class(df[[i]]) == "labelled")
        df[[i]][df[[i] < 0] < NA
}
df <- as_factor(df)
We need to use a URL to import the data file (in the second line of the code). The Q R-server cannot access the files on your local machine. Here, we use a URL to a publicly available site, but you can also read in your files by using URL from Dropbox or other types of cloud storage. Note that for the following code you will need to use a direct link (for Dropbox links, this mean if the link ends in “dl=0”, it should be replaced by “dl=1”). More explanation of the R code above is given in How to Read Stata DTA files into R.
2. Attaching labels to the dataset
Once you have done the first step, you will see that a new dataset has been entered into Q, in the same way as an SPSS SAV file. However, if you look at Variables and Questions tab, you will notice there are considerable differences.
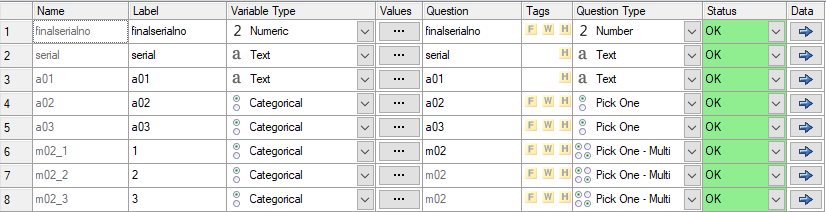
Variables have been automatically assigned as numeric, text, or categorical. But none of the variables have labels, making it difficult to understand this dataset.
In fact, the label information is included inside the R output, but to attach the labels to the data set, we need to run a Q Script. This script is available online here. To use it, save it on your computer, and in Q select from the menu Automate > Run QScript (Macro) from file. The script will then ask for the URL of the DTA file. This should be the same URL used inside the read_dta command in step 1. It will then ask for the encoding of the data file, which can be left blank if unknown. The script will then try ISO-8859-1 or UTF-8 encoding.
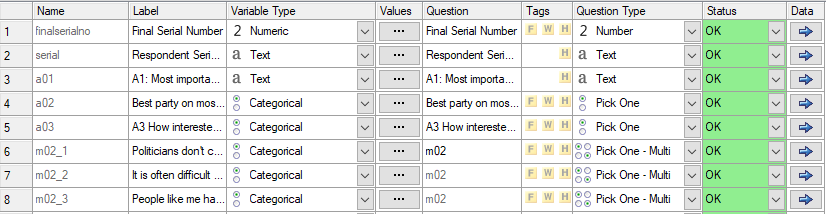
After the script has run, we will see that the information in the Variables and Questions tab has changed. The variables names remain the same, but the variable labels now contain the questions asked in the survey.
3. Grouping variables
The script will also try to group the variables into questions (or multiple response sets). Note that the grouping is based on the variable names, and not from metadata in the input file, unlike Q’s treatment of SPSS SAV files. This may lead to some inaccuracies. There have also been considerable changes to the DTA file format over time. However, the R code and the QScript together provide an easy way to get most of the information from the DTA file into Q. Once imported, labels and question groupings can be easily modified in the Variables and Questions tab.


