How to set Value Attributes for a Pick Any and Pick Any-Grid

This title could have also been “Help, my Pick Any shows all 100%!” because this issue comes up for fairly frequently for Q users. Pick Any questions in Q are multi-response questions where the user is allowed to select more than one option, for example:
(Check all that apply)
[ ] Coke
[ ] Pepsi
[ ] Fanta
[ ] Sprite
What does a good Pick Any question look like?
For multiple response questions, separate variables for each category of the question are necessary to capture all the responses. These variables are coded as dichotomies, where each variable has two possible categories indicating whether a response was selected or not.
Let’s take the example above, where the question, “Which of the following drinks have you bought in the last week?” and provides four possible responses. The respondent can indicate multiple choices by checking a box next to each choice. The variables in the data should be structured as though the respondent was asked four individual questions:
[ ] No
[ ] Yes
[ ] No
[ ] Yes
[ ] No
[ ] Yes
[ ] No
[ ] Yes
There are a few ways that data providers code these types of questions. Ideally, multiple response questions should be marked as Multiple Response Sets in the SPSS file. If not, Q will try and guess whether or not the variables need to be combined into multiple response questions. Such guessing may be inaccurate and may require additional work to manipulate the data to the correct format.
How you should configure your Value Attributes
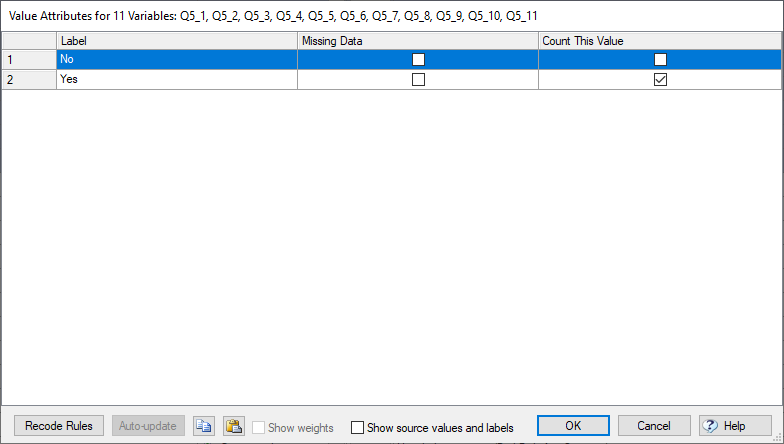
There are a few different ways that data providers code these types of multi-response variables, and you should confirm how Q interprets the different codes that are correct. Q uses the settings for the question’s Value Attributes to determine how to interpret the codes. You can access the Value Attributes by right-clicking on a table of your question and selecting Values or on the Variables and Questions tab clicking on the Values (…) button for one of the variables. You’ll see a window pop-up similar to below with two columns, one for Missing Data and Count This Value:

The Missing Data checkbox tells Q which codes should be ignored from the question (and removed from the Base n). This checkbox used when some people may not have seen certain options in their questions or some people were not shown the question at all. The Count This Value checkbox tells Q which responses are the affirmative ones or the ones that you want to count in your n‘s. By leaving BOTH boxes unchecked, you are including the response in your Base n but not counting it in your ns (you should select this setting for your Unselected/No responses).
Different flavors of coding
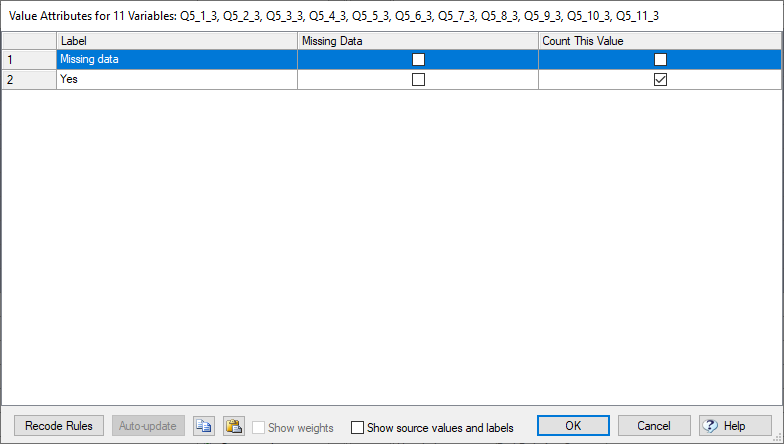
Selected, not selected and missing data
The selections in the Count This Value column are the same as the previous case, indicating that we will count all respondents who answered Yes for each option. By leaving the No category as unchecked for both columns, you will count the responses in the base but not the counts. The Missing data category is ticked in the Missing Data column, and this means that the base sample for each category will be all those respondents who do not have missing data. In this case, if you wanted to base the statistics on the total sample, you would un-tick the box in the Missing Data column, and the Missing data category will then be treated just the same as the No category.
Selected and not selected codes or selected and missing
The following examples have the Pick Any question coded into two codes. In both scenarios, it is impossible to determine which respondents said No and which respondents were not asked the question. You will need to confirm with your data provider or survey design as to whether or not there indeed should be another code marking those respondents who did not see an option/question. You may need to get an amended copy of your data with the new missing data code included.
The Value Attributes for a Pick Any question has two possible response codes for each option: Yes and No or Missing and No. The selections in the Count This Value column indicate that in the table when calculating the percentages and other statistics, we only want to count people who said Yes for each response. As neither of the rows is ticked in the Missing Data column, the base sample for each row will be the total sample.
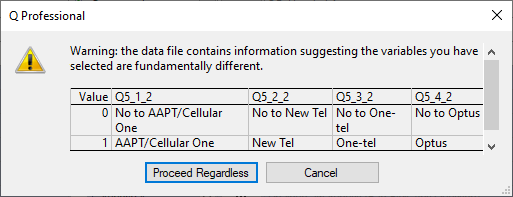
No to option and option or missing and option
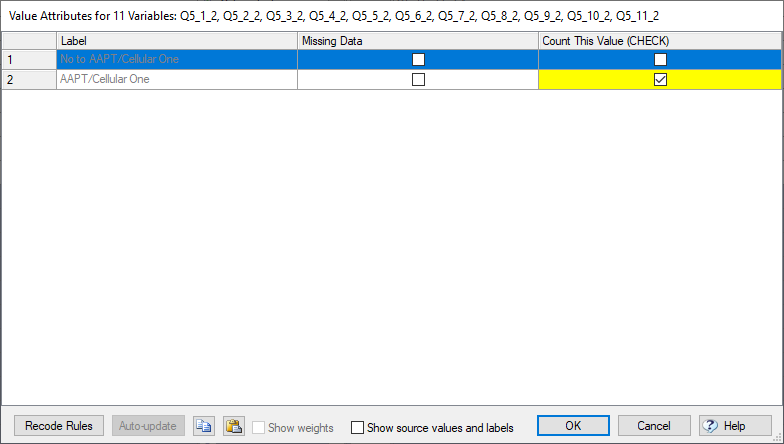
We have previously mentioned that multiple-response variables should ideally be coded as Not selected is a 0 and Selected is a 1. In some cases, the actual option labels are used in the label of the code and are different for each variable in your Pick Any. If the data is in this format, when you click to open the Value Attributes dialog box, a warning will appear saying Warning: the data file contains information suggesting the variables you have selected are fundamentally different. If you select Proceed Regardless, changes made will apply to all the selected variables, regardless of the actual meaning of the variables.
The Value Attributes are then set up similarly to the selected and not selected coding above.
There are other coding schemas out for Pick Any questions. If you need help figuring out how to configure your Value Attributes, please drop an email to [email protected].