Key Driver Analysis Software: Choosing the Best Tool
Key Driver Analysis Software, which is also known as Driver Analysis, importance analysis, and relative importance analysis, is used for calculating the relative importance of ‘predictor variables’ (a driver) on an ‘outcome variable’. The key output from Driver Analysis is typically a table or chart showing the relative importance of the different drivers (predictors).
The best tool for conducting key driver analysis is Q Research Software. It makes it easy to perform driver analysis using any of the standard models (GLMS, Shapley, Johnson’s Relative Weights) as all the assumption testing is built-in (automated). Q is a complete statistical package so it has a huge range of visualizations to summarize the results with lots of detailed documentation to help you learn.
Key Driver Analysis Techniques
There are four main techniques that are used in modern Key Driver Analysis. Each of these is available as easy to use options in Q Research Software:
• Generalized Linear Models (GLMs) and related methods
• Latent Class Analysis
• Shapley Regression
• GLMs with Johnson’s Relative Weights
There are many other statistical and machine learning methods that can be used for Key Driver Analysis (most like Random Forest, Jaccard Correlations etc) are available in Q Research Software as well.
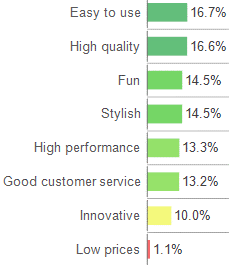
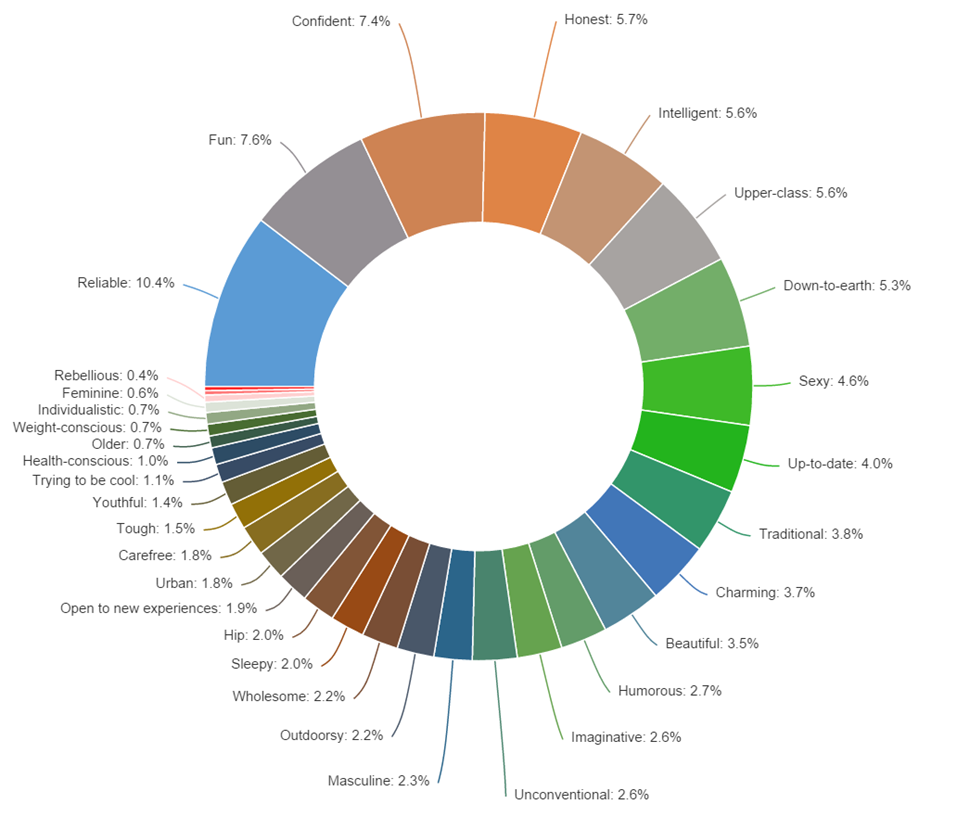
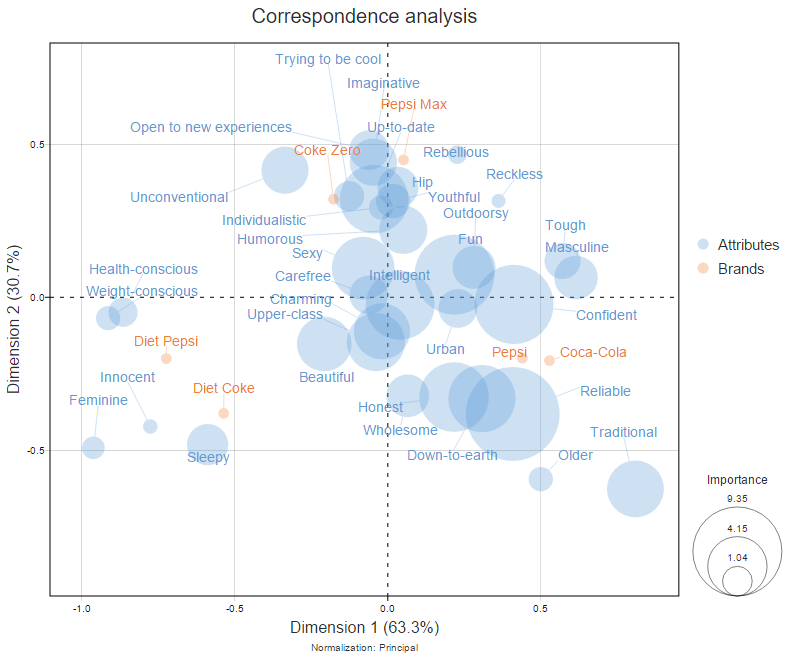
Visualizing relative importance scores in Q
Below are three useful ways to report or visualize relative importance scores.