NPS Analysis: The Best Tool for Analyzing the Net Promoter Score

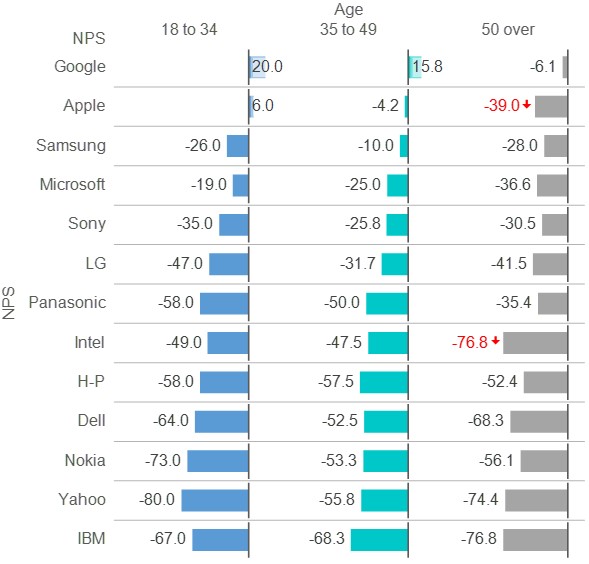
Net Promoter Score or NPS is a great way to evaluate brands, companies, and even divisions within businesses. Good NPS analysis tools are able to apply statistical tests to NPS  so that you know if changes in performance over time are real, or just random noise.  Or being able to test if NPS differs among demographic groups such as age or other segments.

Statistical testing of the Net Promoter Score

Most standard applications calculate NPS by simply subtracting the promoters from the detractors. But this is a pain to analyze. Q Research Software automatically adjusts the NPS score so that differences can be easily and automatically tested for statistical significance. It’s easy, just import your data into Q and it will automatically recognize any likelihood to recommend questions and create a new variable that displays the NPS score.

Q will automatically interpret the NPS in a way that can be used in a wide range of statistical analyses.

See NPS analysis in Q

Analyzing NPS in Q

A key benefit to analyzing NPS in Q is that it automatically testing for differences in NPS score. It is also a complete statistics package so you can easily extend your analysis beyond NPS and get even more insight from your data. Book a demo to find out how.

Device Ownership and NPS
NPS analysis tools

NPS by Age

NPS analysis software: Answering the most frequently asked questions

Why is the traditional measure of NPS are so hard to test for significance?

Traditionally NPS is computed as a difference between percentages, and while there are lots of statistical tests for comparing percentages, there are none for comparing differences in correlated percentages like NPS is (e.g., the more promoters you will likely have less detractors, and vice versa). So Q automatically restructures the NPS variable.

How does Q recode the NPS?

  1. Replacing values 0 through 6 with -100.
  2. Replacing values 7 and 8 with 0.
  3. Replacing values 9 and 10 with 100

Can I recode the NPS this way in other NPS analysis tools?

Yes, you can manually recode your data this way. Although Q is the best tool to analyze NPS data as it automatically recodes your data and is a complete analysis package so from cleaning and formatting your data to advanced stats, visualizations and reports, Q has you covered. Book your demo.

See NPS analysis in Q

No time for a demo of Q?

Start a free trial of Q Research Software now. NO Credit Card required.


Start your free trial

Automate NPS analysis

Find deeper insights

Share better stories

“Much easier to work with than SPSS. It has more advanced analytics that doesn’t require purchasing additional modules.”
Seth DeAvila, Isobar
Cookies help us provide, protect and improve our products and services. By using our website, you agree to our use of cookies (privacy policy).
close-image
close-link