Tips for Rebasing and Filtering Data in Q
Q users are used to setting the base of their tables by applying filters. However, there are other handy ways to rebase data that you might not have seen before.
For instance, did you know that you can automatically rebase multiple response questions to the NET? This is particularly handy when your data supplier does not include correct missing values to indicate when people have skipped a question (this is sadly common in data files from online survey providers).
Perhaps more powerful is the option to rebase a looped question or grid according to people who said they were customers of each brand. You can also split up piped questions according to the brands that people were asked about.
In this post, I look at some of the options in the Automate menu which lets you to do more with your data. The options covered in this article are:
- Automate > Browse Online Library > Create New Variables > Rebase Multiple Response Data to the NET
- Automate > Browse Online Library > Filtering > Filter One Question by Another Question
Rebasing multiple response questions to the NET
Sometimes you’ll have a Pick Any (multiple response) question where the percentage in the NET is less than 100%.
This happens when some people in the sample did not select any of the options. This can sometimes happen when there is a skip in the questionnaire, but the data provider has not coded this properly as Missing Data. Consider the following example, which shows the percentage of people who indicated that the following items were important to them when ordering delivery:
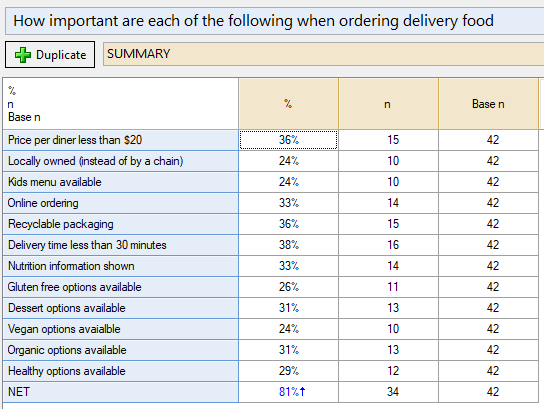
Only 34 people selected any of the options. If it were the case that the remaining 8 people do not have an answer for this question because they skipped it (for example, because they indicated previously that they did not order any delivery food), then the true NET should be 100%. When you get data like this that is not set up properly in the file, then you need to be very familiar with how your survey was conducted to make this kind of judgment – be careful!
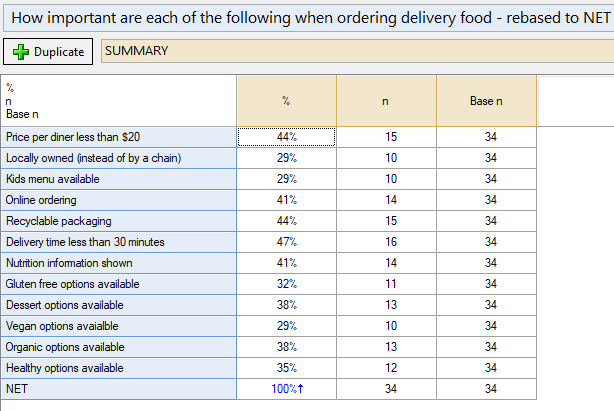
Assuming that this is the case, then you can rebase the data in this table by selecting Automate > Browse Online Library > Create New Variables > Rebase Multiple Response Data to the NET. The result is a new copy of the data where each of the 8 people who did not give an answer to any of the options are now coded as Missing Data, and the new table looks like this:
On a related note, it is also possible for you to add a “None of these” option to any Pick Any question in Q. This allows you to display the number of people who did not choose any of the options instead of excluding them. Simply select the rows for your question in the Variables and Questions tab, right-click, and select Insert Ready-Made Formulas > Pick Any Question -> Pick Any Question with ‘None of these’.
Building awareness or purchase into the base
It is common for researchers to want to choose a different base when analyzing Pick One – Multi questions (single response grids), Pick Any – Grid questions (multiple response grids), and other questions involving several variables. For instance, you may have a question where people rate a set of brands, but you want to calculate the ratings based only on people who told you earlier that they purchase products from those brands. This is one of many types of tasks that you can automate using Automate > Browse Online Library > Filtering > Filter One Question by Another Question.
Let’s take the following example where we have a brand association question (Pick Any – Grid) which shows the proportion of people who associate a range of supermarket brands with having good quality products, a good range of products, etc. Currently, all of the results are based on the total sample of 500 people who answered this survey.
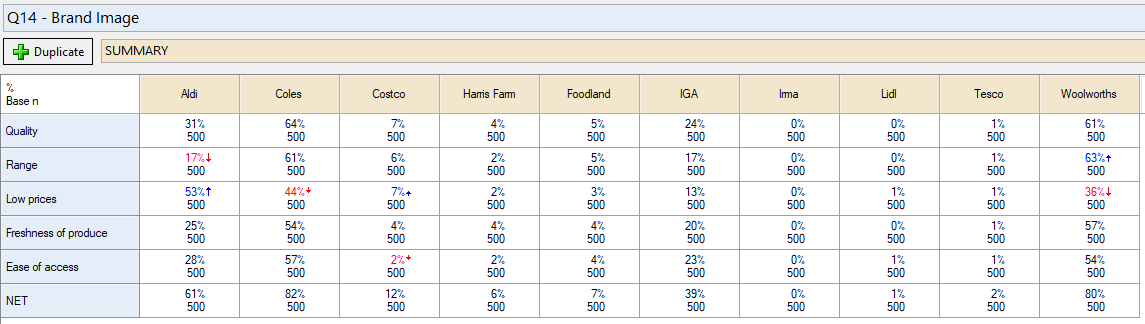
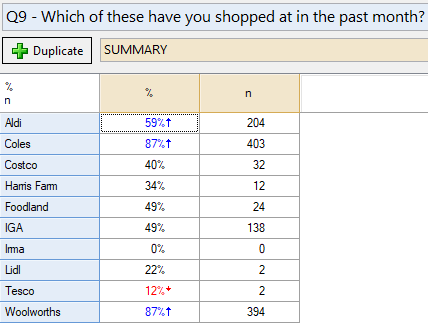
We may wish to re-base the data so that it only bases the figures only on people who indicated that they have shopped at each supermarket in the past month. If the questionnaire is designed with this intent from the start, and your data supplier does a good job, then you should get the correct base automatically. However, if you change your mind about the sample during your analysis, or if the data provider has not correctly coded skips with Missing Data, then you might be left without the desired base sample. The desired bases are represented in this table:
To rebase the grid we can:
- Select Automate > Browse Online Library > Filtering > Filter One Question by Another Question
- When prompted to Select the question you want to filter, pick the Q14 – Brand Image question from the list and click OK.
- When prompted to Select the question whose categories you want to use as filters, select Q9 – Which of these have you shopped at in the past month?
- When asked if you want Q to match up the filters automatically, click Yes (more on this below)
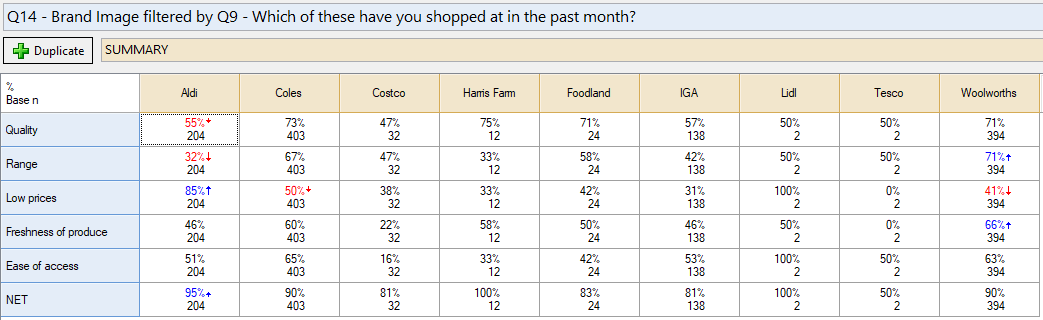
A new copy of the question is created, where the selections from Q9 are built in as “filters”. By this, I mean that people who did not select a brand are given a missing value for that brand in the new copy of the grid. The result looks like this:
Matching the categories
In Step 4 above, I asked Q to automatically match the brands from Q9 with the brands from Q14. It was able to match up all of the brands correctly. If Q is unable to match brands (because of typos or other messiness in the labels), then it will give you the option to manually match up which filter category should be used to filter each part of the grid.
Splitting up data according to brand
The same option may also be used to split up a variable which contains data for multiple brands. This is common when you pipe brands through the questionnaire. For example, you may begin by asking the survey respondent where they last shopped, and then later questions will all relate to that brand.
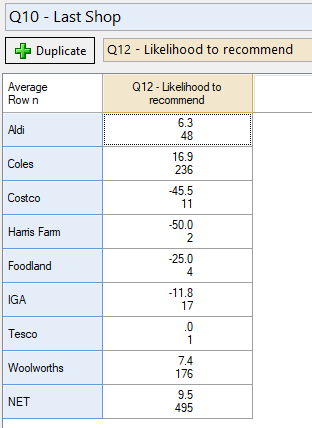
In some cases, even though several different brands were included in the study, key data like Net Promoter Score may be stored in a single variable. While you can split the data up by creating a crosstab of NPS by brand, this does not allow you to see how a brand’s NPS is tracking over time or how it varies with other questions.
Such data will begin like this:
To create a new set of Likelihood to recommend variables, with one for each brand, I can do the following:
- Select Automate > Browse Online Library > Filtering > Filter One Question by Another Question
- When prompted to Select the question you want to filter, pick the Q12 – Likelihood to recommend question from the list and click OK.
- When prompted to Select the question whose categories you want to use as filters, select Q10 – Last Shop and click OK.
And the result is:
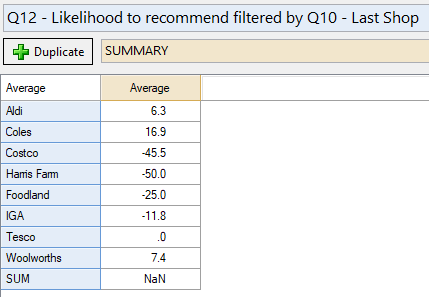
Note importantly that there is now room in the Brown drop-down menu for me to crosstab with an additional question.
The option Filter One Question by Another Question is a bit of a Swiss army knife that can do even more, but these are the two main uses.
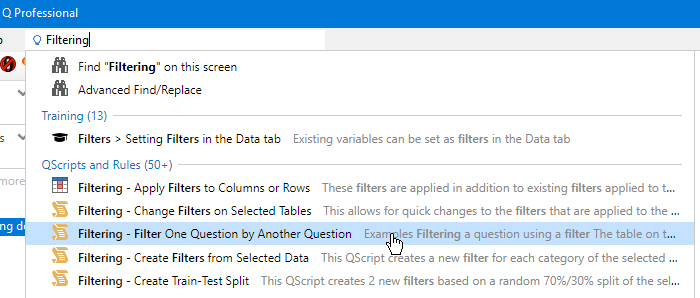
A tip for working with the Automate menu
The Automate menu has grown to a massive size since we introduced it a few years ago, and it can be somewhat daunting to look for tools in the menu. If you are unsure if there is an automatic option for what you want to do, just type what you are interested in into the Search features and data box in the top-middle of the Q window. The QScripts and Rules section of the results will hopefully contain options that will save you a lot of time!