
Understanding the Sample Size in Multiple Response Questions
When analyzing multiple response questions in Q, it’s important to understand the sample your numbers are based on. This will help you to communicate your results effectively. Complex survey programming and skips can lead to different people being shown different options when completing the survey. This information is important to the analysis of the data.
When a respondent is not shown a question or an option within a question, then a good survey provider will mark that person with a Missing Value. If your provider does not do this, you should go back and ask them to code the data this way.
Q automatically picks up on missing values when you import your data. Then it excludes those people from the base sample used to calculate statistics. You can make choices about changing the base used, but the safest starting point is to exclude anybody who has a missing value. This makes the fewest assumptions about the meaning of the data. It also maximizes the chance that you will identify the nature of the data.
Missing data can occur in any type of survey question, but in this article, I focus on missing data in multiple-response questions, which Q calls Pick Any questions.
Missing data usually occurs when respondents skip a question or are not shown an irrelevant part of a question. For example, if someone states that they are not aware of In-N-Out Burger, then showing In-N-Out Burger in a follow-up question about that brand becomes pointless.
Missing data is also common when new brands are added to a tracking study, or when old brands are dropped. If you want to report the proportion of people aware of In-N-Out Burger who have eaten there, then you definitely want to exclude that person from the sample in the second question.
How do I check the sample size?
Let’s take an example from a survey about supermarket shopping. Question 9 asks, “Which of the following have you ever shopped at?” This question follows: “Which of the following have you shopped at in the past month?” If a person did not select one of the supermarkets when asked where they have ever shopped, then they were not shown that supermarket when asked where they have shopped in the past month.
The first thing to pay attention to is the table footer, which you’ll find in the bottom-right corner of the Q window. When missing data exists in your question, you might see something like this:

The total sample size for this data set is 500. Within this question, the sample size ranges from 0 to 463 people for different items. This should make you stop and pay attention. Not all of the numbers in the table are based on the same set of people!
Next, take a look at the table statistics. Right-click and select Statistics – Cells, then choose n (number of people to select the option) and Base n (number of people shown each option). The table for this survey question looks like this:
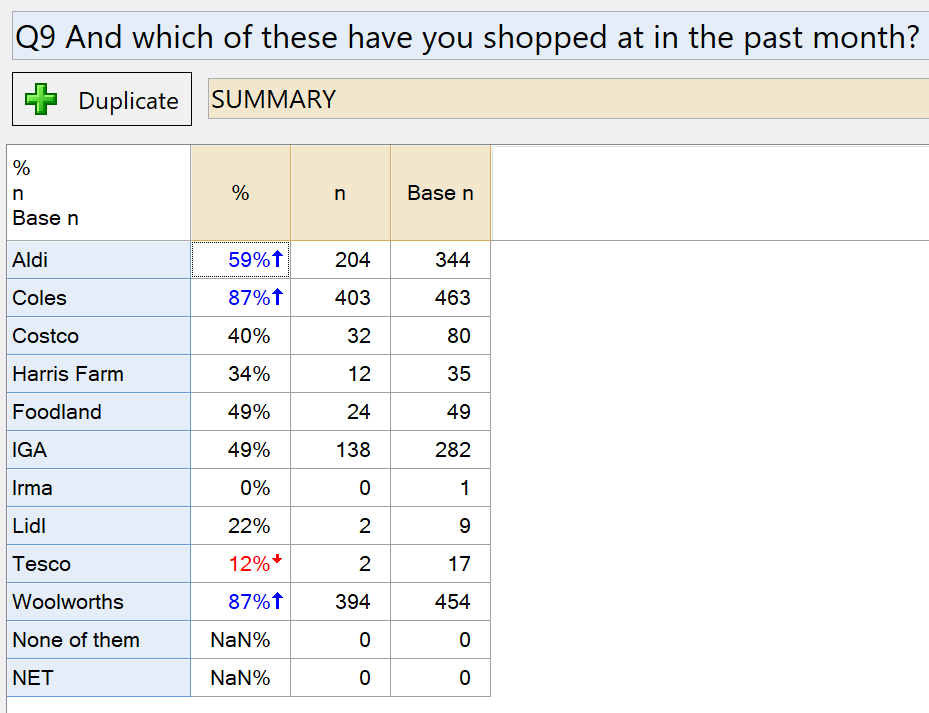
The way to read this table is as follows. 59% of the respondents who have ever shopped at Aldi have shopped there in the past month (204 / 344). This is in contrast to Coles and Woolworths, where 87% of people who ever shopped in those supermarkets did so in the last month. These statistics can be thought of as conversions.
Choosing how to base the question
For this example, there are two questions you can answer:
- For people who have ever shopped at each store, what proportion of them have shopped there in the last month? The table above answers this question.
- What proportion of the total sample has shopped at each store in the last month?
The second question is logical to answer with this data: if someone said they never shopped at Aldi, then they cannot have shopped at Aldi in the past month. This is a case where you can be confident about what a respondent would have said if they had been shown all the options in the questionnaire.
However, there are times when you cannot draw this conclusion. Often, data is missing, and you don’t know what the respondent would have selected if they had been shown an option. One example of where this can occur is randomization, where, for the sake of providing a short survey, you randomly assign subsets of the options for respondents to choose from. Another example is when you introduce a new brand into a tracking study. Old respondents will have a missing value because you can’t know if they would have said that they shop at a particular place since they were never asked.
When you can be confident about the nature of the missing data, then it is safe to turn it off. This would be appropriate to answer the second question in this example: “What proportion of the total sample have shopped at each stored in the last month?” To do so:
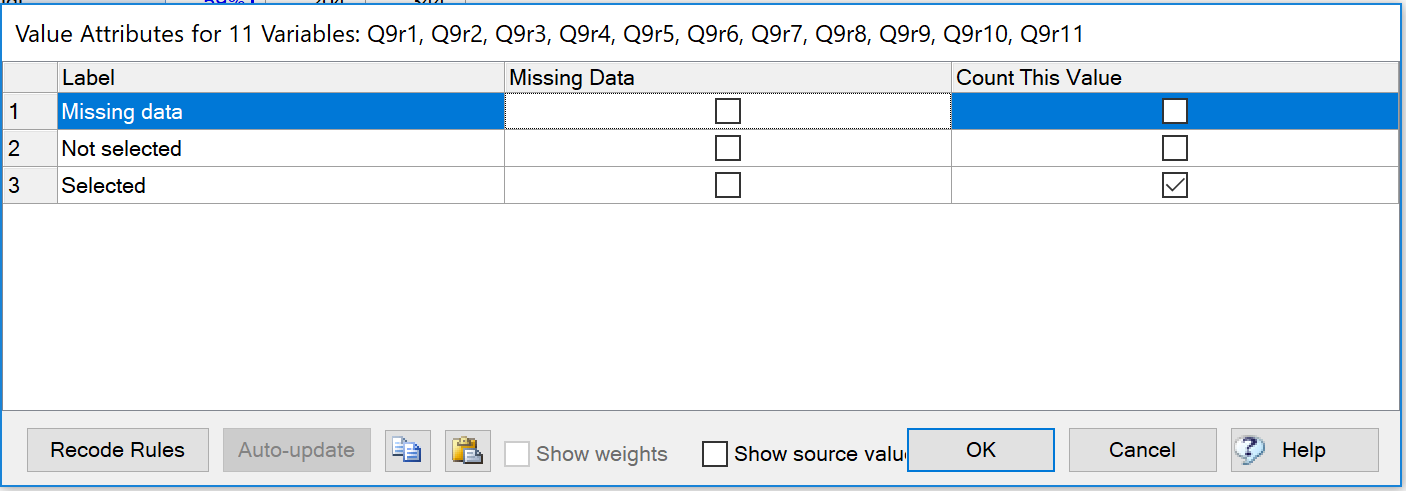
- Right-click on one of the rows in the table and select Values.
- Un-tick the box in the Missing Data column.
- Click OK.
When you un-tick the Missing Data box, Q will include those people in the base again. For this example, the table changes to look like this:
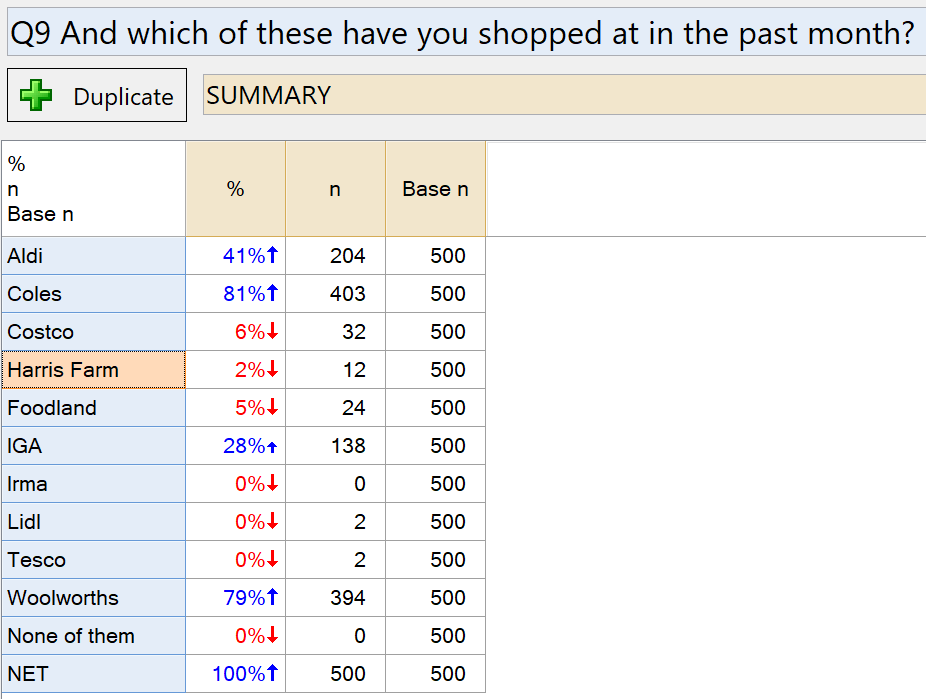
Notice that the Base n column now shows the full sample size of our study. You can conclude that 41% of the sample in this survey have shopped at Aldi in the last month, with much higher scores (81% and 79%) for the market leaders Coles and Woolworths.
What is going on with the NET?
The result in the NET row for the first table can look strange if you are not used to working with missing data in Q. The Base n for the NET is 0, and this results in a percentage of NaN%. (NaN stands for Not A Number, and one of the ways you get such a result is trying to compute a percentage for an empty sample).
Why is the NET empty? Whenever you combine rows of a table, by merging or creating a NET, Q will only include people in the base who have non-missing data for all of the options that you combined. The table NET is the same as merging together all of the rows. In this case, there is no-one in the sample who has complete data for all of the rows, and the NET is empty as a result.
Why does it work like this? This is the conservative approach. We are avoiding making assumptions about what respondents would have selected if they had given an answer, and we are avoiding reporting that the figures are based on a larger, more robust, sample when this is not true.
What about crosstabs?
A similar issue arises when using the question in a crosstab. Consider the same question when crossed with Gender (with Missing Data turned on):
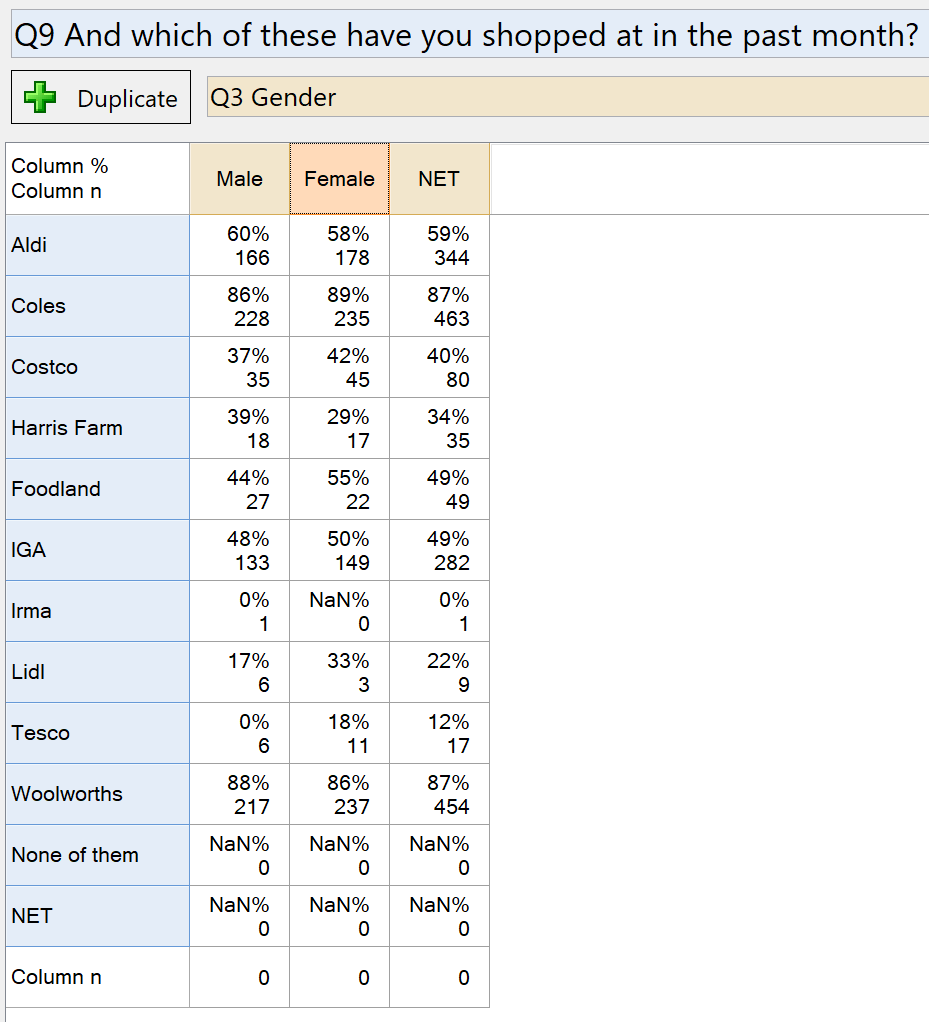
The Column n shown at the bottom of the table is zero for each column, despite the fact that there is obviously data in the table. The meaning of the Column n here is “the number of people from each column who have complete data for all the rows.” The results are zero because (as with the NET above), no-one has non-missing data for all the rows. The only way to discover the true sample sizes for the Column % is to look at the Column n statistic within each cell.
While some people want to see a different sample size at the bottom of the table (for example the largest Column n, or the original sample size for the column category), it can be dangerous to do this when reporting on these figures. If your stakeholders believe that the 60% for Aldi is based on the 248 Males in the sample, rather than the 166 Males who ever shopped at Aldi, they may reach the wrong conclusion about these results.
Further reading
For more detail, examples, and troubleshooting on this issue, check out these articles from the Q Wiki:


