Using Partial Least Squares to conduct relative importance analysis in Q

Relative importance analysis is a general term applied to any technique used for estimating the importance of predictor variables in a regression model. The output is a set of scores which enable the predictor variables to be ranked based upon how strongly each influences the outcome variable.
There are a number of different approaches to calculating relative importance analysis including Relative Weights and Shapley Regression as described here and here. In this blog post, I briefly describe an alternative method – Partial Least Squares (PLS). Because it effectively compresses the data before regression, PLS is particularly useful when the number of predictor variables is more than the number of observations.
Partial Least Squares
PLS is a dimension reduction technique with some similarity to Principal Component Analysis. The predictor variables are mapped to a smaller set of variables and within that smaller space, we perform a regression on the outcome variable. In contrast to Principal Component Analysis where the dimension reduction ignores the outcome variable, the PLS procedure aims to choose new mapped variables that maximally explain the outcome variable.
Loading Example Data
First I’ll start a new project with File > New Project then add some data with File > Data Sets > Add to Project > From URL… and paste in this link :http://wiki.q-researchsoftware.com/images/6/69/Stacked_Cola_Brand_Associations.sav
The brand preference table subsequently displayed includes a Don’t Know category that doesn’t easily fit in the linear scale from Love to Hate, so I right-click on top of Don’t Know and select Remove.
Using Partial Least Squares in Q
PLS is not available in the menus of Q, but we can get to it by typing a few lines of code.
From the Create menu select R Output and enter the following snippet of code,
The first line selects pref as the outcome variable (strength of preference for a brand) and then adds 34 predictor variables, each indicating whether the respondent perceives the brand to have a particular characteristic. The names and labels of the variables can be seen in Q on the Variables and Questions tab.
Next, the 3 libraries containing useful functions are loaded and since the R pls package requires inputs to be numerical I convert the variables from categorical.
In the final line above the plsr function does the work and creates pls.model.
Automatically Selecting the Dimensions
The following few lines recreate the model having found the optimal number of dimensions,
Producing the Output
Finally, we extract the useful information and format the output,
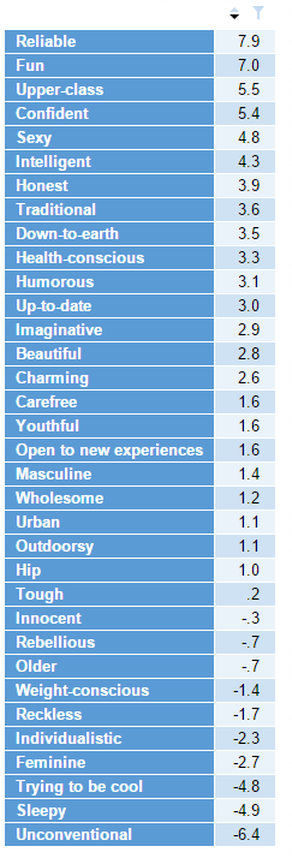
The regression coefficients are normalized so their absolute sum is 100. The labels are added and the result is sorted.
The results below show that Reliable and Fun are positive predictors of preference, Unconventional and Sleepy are negative predictors and Tough has little relevance.