


As Q and Displayr are 100% compatible with each other, and you can upload and download your documents to work between them. If you’re a Q user, you can take advantage of many benefits that Q offers, and then transfer your work into Displayr. This can provide you, as a Q user (the best market research analysis software), with enormous efficiency in your quantitative workflow (including online reporting and dashboarding).
In this post I am going to walk through importing a Q project into Displayr. It is a simple case study, using a small data set kindly provided by Ray Poynter of NewMR. The data set looks at different statistical techniques and analysis software used by a sample of 267 market researchers and insight managers. In this example sample data file, I removed the non-researchers and people not using techniques and software. I have also performed my basic data tidying and creation of tables in Q. This can also be done in Displayr, but Q is more efficient at this.
Step 1: Upload a QPack to Displayr
A QPack is a compressed file that contains both your project work and the associated data file.
- Open your project in Q
- Select File > Save as…, change the File type option to Q Pack Files, choose a file name, and press Save
- In Displayr, go to the Documents screen, press + Upload Document and select your file (ending in .QPack) and press OK
If you want to reproduce what I do in this post, you can download the QPack from here.
Step 2: Create your pages and folders in Displayr
Although Q and Displayr are 100% compatible, they are different in terms of how they present things and also how a few things work. See the Q Wiki for an overview of differences.
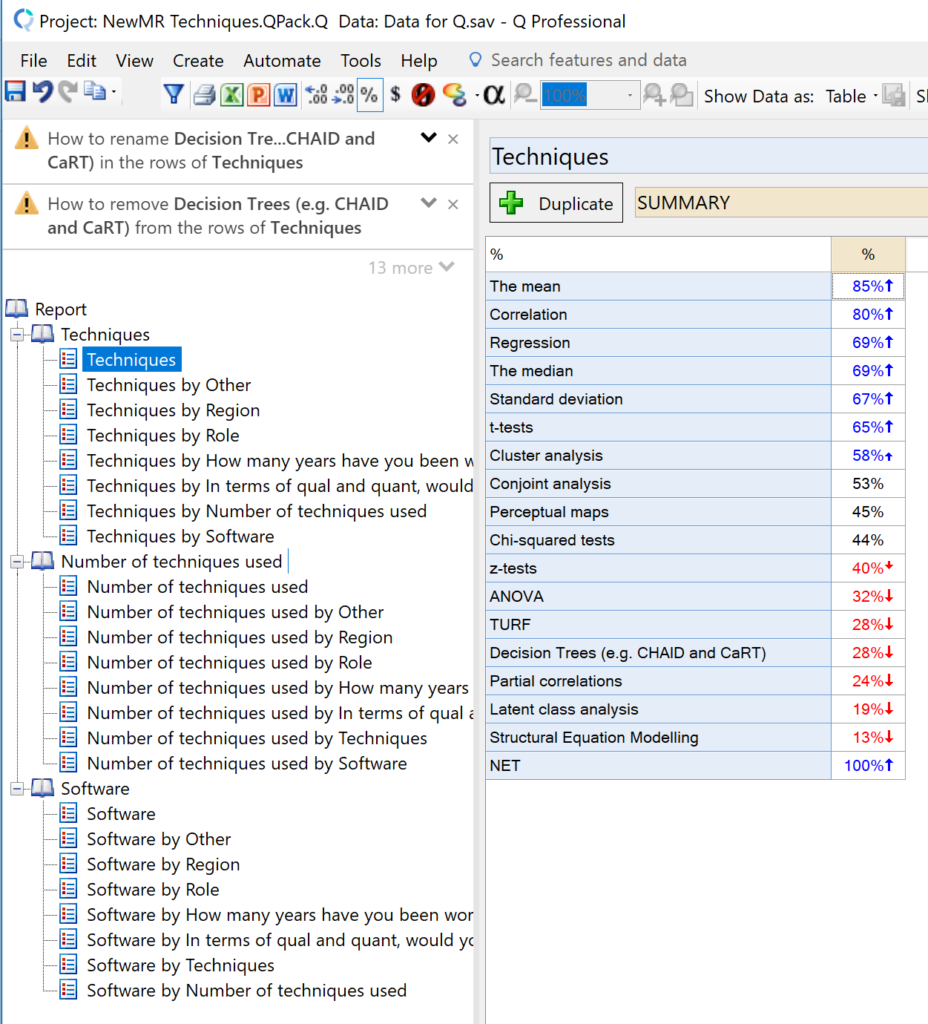
A key difference you will notice is that Displayr is organized around pages, whereas Q is organized around tables. The main consequence of this is that you all your folders in Q turn into blank pages in Displayr (blank pages that are also folders). For example, the screenshot below shows this data set in Q, where I have three folders containing crosstabs.
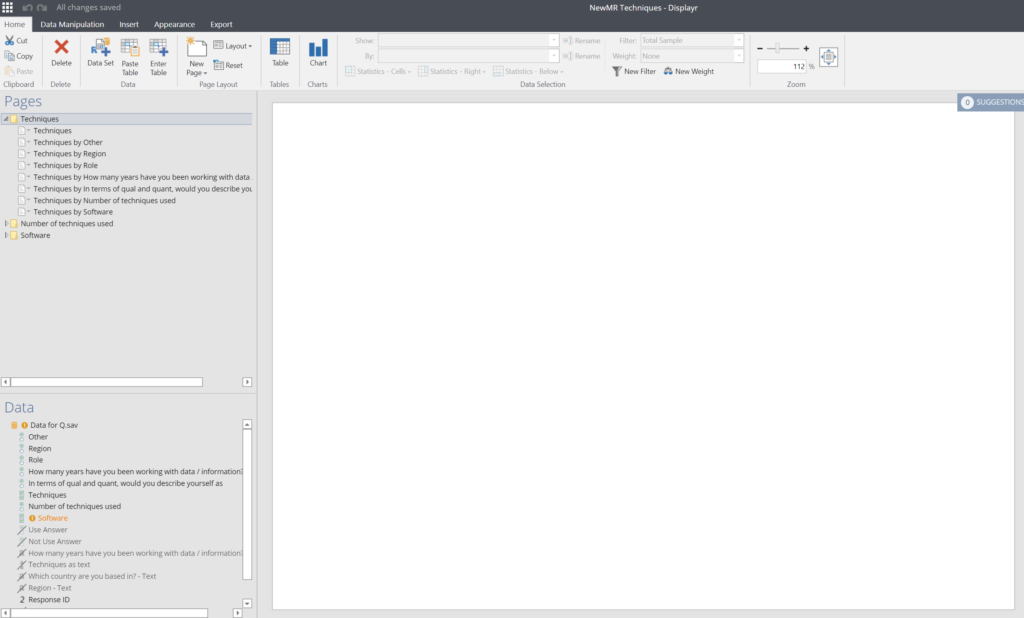
And here is the project in Displayr, where the first page is blank. My folder Techniques has become a blank page called Techniques, which also acts a folder for other pages (each page containing one of the crosstabs I had in Q).
Step 3: (Optional) Hiding all your Q work in the Displayr document
If you are using Q for your analysis, there is a good chance that you may want to continue to use Q later, as well as using Displayr. If this is the case, the trick is to avoid inadvertently deleting your Q work when you create your dashboard in Displayr. You can do this as follows in Displayr:
- Home > New Page > Title Page
- Type My Q stuff or whatever name you want into the heading field.
- Select all of your existing Q work (from the Pages tree), and drag it onto this new page.
- Hide the folder you have created: Appearance > Hide (Layout).
Step 4: Create your dashboard
Now, with the data in Displayr, it is time to build a dashboard. Building a Simple Dashboard in Displayr continues where this post leaves off, building a dashboard for this data file in Displayr. In the example dashboard in that post, I also deleted the My Q Stuff folder (rather than keeping it as described in the optional step 3 above). The reason for that was simply to make that post completely self-contained (if you are replicating the steps in this post, you can choose to either delete it, or not).


