

Your Guide to Using Built-in Mathematical Functions in Q

Q contains several useful built-in mathematical functions that make it easy to do calculations on your existing data without having to write JavaScript, Excel formulas or R code. In this post, we’ll go over a few examples of the more common built-in functions.
The built-in mathematical functions can be accessed from the Variables and Questions tab by highlighting the variables you want to perform the calculation on and then right-clicking and selecting Insert Ready-Made Formula(s) > Mathematical Functions (by Case). Then, simply select the function you want.
Sum
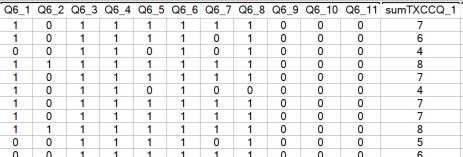
The Sum function is used to calculate a total across a multiple variables. In the example below, respondents were asked which of the following cellular provider brands they are aware of.

We can see from the table that awareness of the different brands varies significantly with some brands having very high awareness and others very low. We may also want to look at the total number of brands that respondents were aware of. Note that each of the above variables is a binary (Pick Any) variable, so we can simply sum these variables to obtain the total. To sum these variables, go to the Variables and Questions tab and highlight all of the brand awareness variables. Right-click and select Insert Ready-Made Formula(s) > Mathematical Functions (by Case) > Sum. Click Yes when prompted to compute observations with incomplete data. A new variable is created containing the sum.
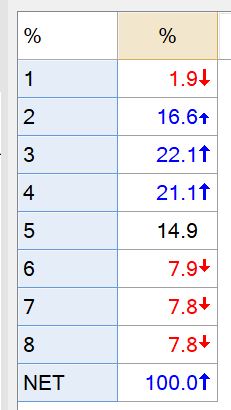
If you set the Question Type of the Sum variable to Pick One, you can create a table to show the distribution of the number of brands, respondents are aware of. In this example, 60% of the respondents were aware of between 2 and 4 brands.
Average
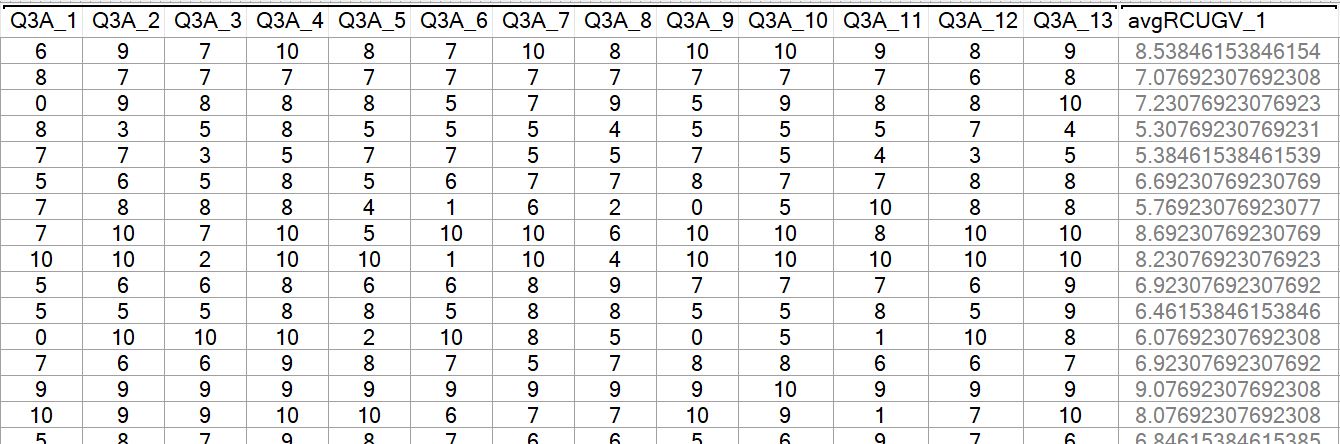
In the next example, we’ll look at the Average function to calculate the mean respondent NPS rating across various technology brands. Again, highlight all of the variables and from the Mathematical Functions menu select Average. A new variable showing the mean respondent rating will be added to the data set.
Count
When used with binary variables, the Count function will essentially give the same result as the Sum function since counting the number of selections made in a Pick Any gives the same result as summing.
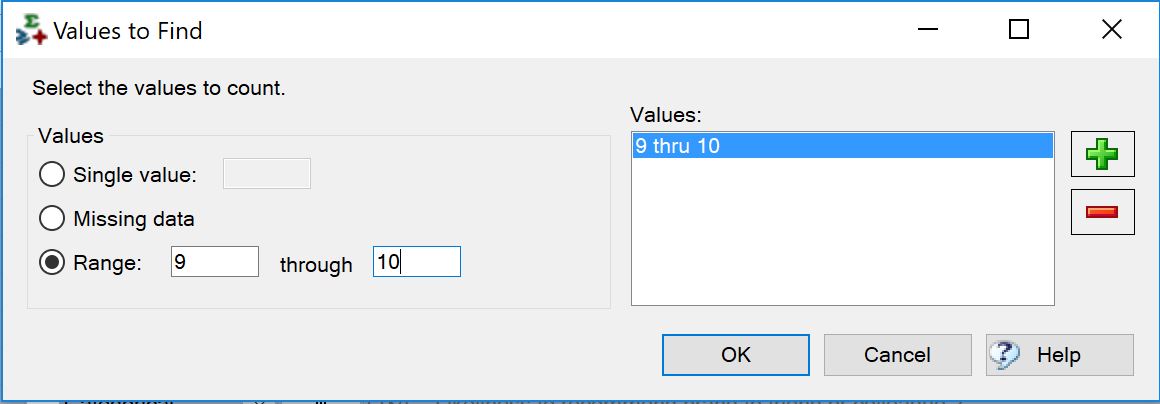
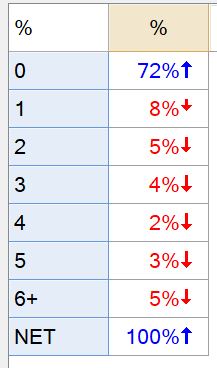
However, when used with a Pick One – Multi question, you can select the specific values or range of values that you want to count. Continuing with our technology NPS data set, let’s suppose we now want to know, on average, how many of the 13 brands respondents are promoters (gave a 9 or 10 rating). To get this count, we highlight all of the variables, right-click and select Insert Ready-Made Formula(s) > Mathematical Functions (by Case) > Count. Next, we’re prompted to select the specific values we want to count. In this case, we’ll select Range and enter 9 through 10 as the range values.
This creates a new variable which when set as a Pick One question, will show the distribution of brands that respondents are classified as promoters for. In this case, we see that 72% of our sample is not a promoter of any of the brands.
Any of
The last function we’ll cover here is Any of. This function identifies respondents who have selected any of a subset of options in a Pick Any question. In this example, we’ll look at a series of brand attributes that were offered to describe a particular brand. The distribution of responses is shown in the following table:
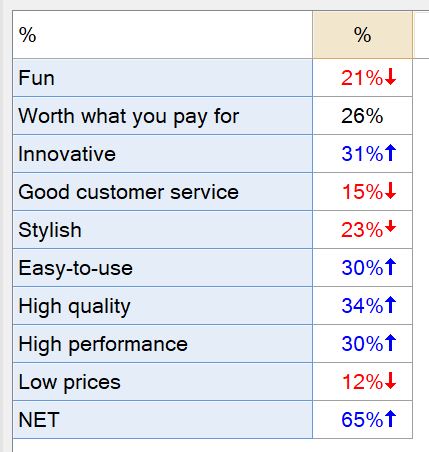
Perhaps now we’re interested in finding out how many respondents selected at least one of the attributes. To work this out, we go to the Variables and Questions tab, we highlight all of the attribute variables, right-click and select Insert Ready-Made Formula(s) > Mathematical Functions (by Case) > Any of.
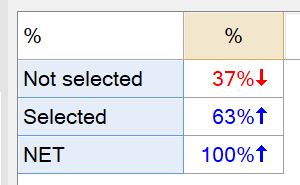
A new variable Pick One variable is created showing that more than 1/3 of the respondents did not select any of the attributes to describe this particular brand.
Other Functions
In addition to the examples above, the following mathematical functions are also available in Q:
- Minimum
- Maximum
- Standard deviation
- Variance
- None of


